 Mira Pro
x64 includes an integrated 3-D viewer that renders 2-D images in 3-D,
providing additional opportunities for inspecting and analyzing both images
and model data. This Brief illustrates some of the variations possible for
visualizing image data.
Mira Pro
x64 includes an integrated 3-D viewer that renders 2-D images in 3-D,
providing additional opportunities for inspecting and analyzing both images
and model data. This Brief illustrates some of the variations possible for
visualizing image data.
Mira's 3-D plotting tool renders rectangular regions of 2-D images of any size and with bit depths from 8 to 64 bits per pixel, integer or real data type (not RGB). And it works with image stacks too. With Mira Pro x64, a single button click can also render a region of an image stack of any depth, such as 10, 100, or even more images. You can animate them, rotate, tilt, adjust the palette, or change Z-axis scaling on the fly.
Mira Pro x64 provide a combination of 4 plot types with 6 pixel representations (Mira Pro has 2 representations). Combine these options with illumination changes, Mira's exceptional palette manipulation, and you get many more variations than are shown below.
|
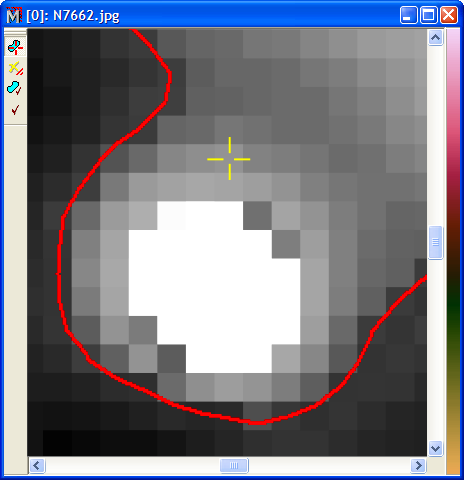
2-D ImageThis 2-D image shows an extreme enlargement of an image displayed by Mira. The red curve shows a contour of constant value computed by Mira. The contour gives the user some additional information about the shape of the profile. Multiple contours could have been computed at various values to give even more information. Still, there are other ways to look at the object using 3-D rendering. |
|
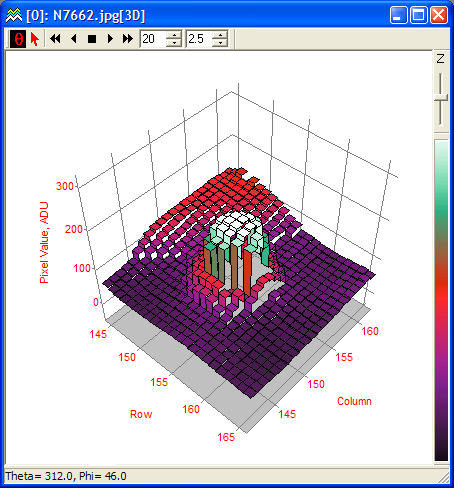
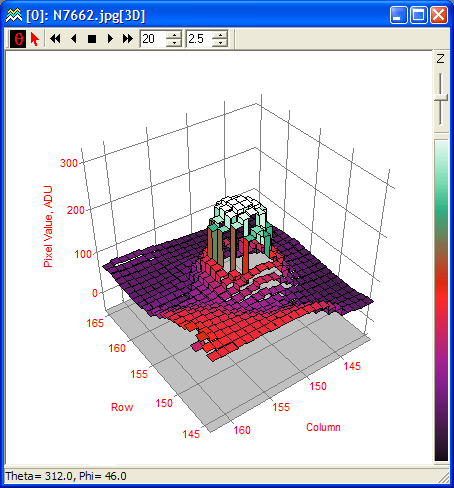
Stepped Ribbon PlotThis 3-D view shows the region of the 2-D image shown above. Here, we show an intensity surface plot with a stepped ribbon pixel representation. The intensity surface maps the data Z-value to a palette entry. The stepped ribbon representation gives the data pixels a flat top but provide some transparency for viewing through the rendered data. The palette was changed from grayscale to one of the stock pseudocolor palettes to more clearly distinguish changes in Z value. This plot is rotated 48� counterclockwise relative to the 2-D image. |
|
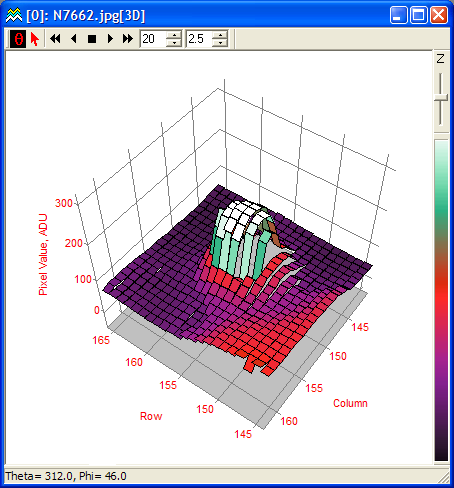
Stepped Ribbon Plot, Rotated in AzimuthThis view shows the same stepped ribbon plot as above, but the viewpoint has been rotated around to the opposite side. 3-D rotation in Mira is dynamic, using mouse movement to tilt or rotate the rendering in real-time. |
|
Standard Ribbon PlotThis plot is similar to the stepped ribbon except that it connects pixel values at their center rather than at their edges. The plot type was changed to one of numerous options by clicking a bullet on a Mira dialog. |
|
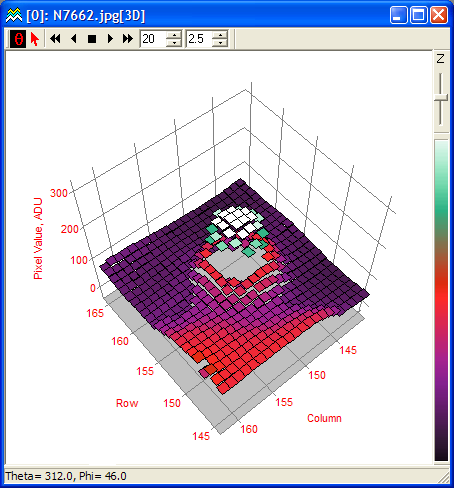
Pixel PlotIn this view, the pixel representation was changed to pixel, which plots the pixel value as a constant-Z surface while removing all sides facets. The advantage of this representation is that the plot is maximally transparent while still showing the Z-value of the data. |
|
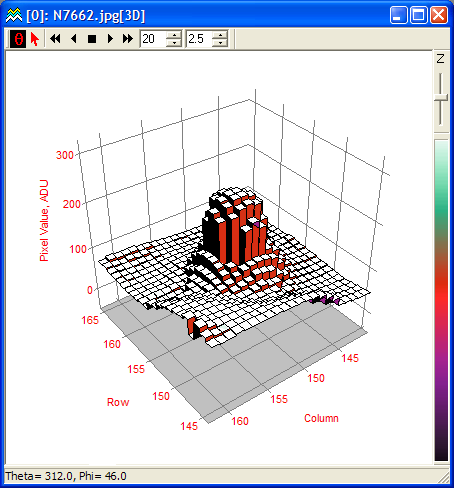
Illuminated Surface with Pedestal RepresentationFor this view, the plot type was changed from intensity surface to illuminated surface and the pixel representation was changed from ribbon to pedestal. The illuminated surface plot uses a light source and Phong Shading to recreate a visible surface. All the Phong parameters are adjustable, in real-time. |