 This
brief describes some of the point source photometry capabilities of
Mira Pro x64. This
tutorial steps through the basic functionality of the Aperture
Photometry package as applied to multiple images in an "image set". This technique is
sometimes also called "Serial Photometry" because the same object is measured in
a series of images. This tutorial assumes you understand how to display
an image and work with an image set. In this exercise we use observations of the minor planet Xanthippe
to place limits on variations in its brightness over a short time period. In minor planet studies, these
variations are used to characterize the rotation or tumbling of the body. The same
methods could be used for analysis of variable stars, to search for
stellar eclipses caused by extra-solar planets orbiting stars, or for other
types of investigation. This Tutorial is taken the Mira User's Guide.
This
brief describes some of the point source photometry capabilities of
Mira Pro x64. This
tutorial steps through the basic functionality of the Aperture
Photometry package as applied to multiple images in an "image set". This technique is
sometimes also called "Serial Photometry" because the same object is measured in
a series of images. This tutorial assumes you understand how to display
an image and work with an image set. In this exercise we use observations of the minor planet Xanthippe
to place limits on variations in its brightness over a short time period. In minor planet studies, these
variations are used to characterize the rotation or tumbling of the body. The same
methods could be used for analysis of variable stars, to search for
stellar eclipses caused by extra-solar planets orbiting stars, or for other
types of investigation. This Tutorial is taken the Mira User's Guide.
Open the Images
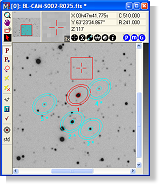
To begin, load the Open dialog by clicking File > Open on the pull-down menu. In this
exercise you will learn to measure not
 only
one image, but 9 images as an Image
Set. In the Open dialog, select the 9 images as shown below. Make sure the Open
as Image Set option is selected in the Options list as shown (we want
all 9 images to open as in Image Set in one window, not in separate windows). Then click [Open]
to load the images.
only
one image, but 9 images as an Image
Set. In the Open dialog, select the 9 images as shown below. Make sure the Open
as Image Set option is selected in the Options list as shown (we want
all 9 images to open as in Image Set in one window, not in separate windows). Then click [Open]
to load the images.
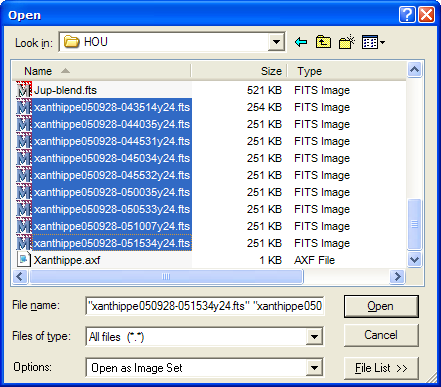
After the images open you will see that they are "raw", or uncalibrated, by noticing the scattered "hot pixels". They were also acquired under less than perfect observing conditions at Yerkes Observatory, yet we will obtain good photometry of this data set. Normally, when doing precision photometry, you would probably wish to first calibrate the images by removing bias, dark, and flat field effects.
Now let's do some photometry. Inside the image window, click ![]() on the Image Toolbar. This opens the Aperture Photometry Toolbar on the left border of the window (see below).
Like all window toolbars, this one opens in Marking Mode, with the top toolbar button pressed. In Marking
Mode, clicking on the image places a marker — in this case, clicking on the image marks objects for photometry.
At first, a number of toolbar buttons are grayed-out, or disabled, which means they cannot be used. They
will be enabled after the first object is marked. Also notice that the Image
Cursor is visible as a red square in the middle of the image; if you don't want to see it, right-click
on the Cursor button
on the Image Toolbar. This opens the Aperture Photometry Toolbar on the left border of the window (see below).
Like all window toolbars, this one opens in Marking Mode, with the top toolbar button pressed. In Marking
Mode, clicking on the image places a marker — in this case, clicking on the image marks objects for photometry.
At first, a number of toolbar buttons are grayed-out, or disabled, which means they cannot be used. They
will be enabled after the first object is marked. Also notice that the Image
Cursor is visible as a red square in the middle of the image; if you don't want to see it, right-click
on the Cursor button ![]() and select Hide from the popup menu.
and select Hide from the popup menu.
Note that all images are displayed with negative brightness. This affects the view, but not the actual image values.
 Which
point source in this image is actually the minor planet Xanthippe? This is easy to answer! Using
the red thumb on the scrollbar at the bottom of the window (on the Animation
Toolbar), slide through the image set. You will see Xanthippe move relative to the stars. If the stars
moved very much, we might consider Registering(aligning) the images before doing photometry. In this case, the images are already registered.
Which
point source in this image is actually the minor planet Xanthippe? This is easy to answer! Using
the red thumb on the scrollbar at the bottom of the window (on the Animation
Toolbar), slide through the image set. You will see Xanthippe move relative to the stars. If the stars
moved very much, we might consider Registering(aligning) the images before doing photometry. In this case, the images are already registered.
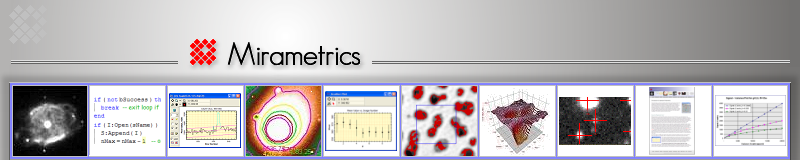
Next, move the mouse pointer onto Xanthippe (circled below) and click the left mouse button. This marks and measures the first target object on the first image. The magnitude may be negative, which is normal if the photometric zero point value has not yet been computed for this image. To determine and apply the zero point, you need to mark standard stars of known brightness.
Add Standard Stars
 Next you will mark a standard star of known magnitude. Click the second toolbar button
![]() to enter Standard mode and move the mouse pointer onto the bright star at "1
o'clock" above Xanthippe. Click the mouse to mark the standard star. This
opens a dialog requesting the magnitude value for the standard star. In this
particular example, the magnitude is unimportant because we are interested
in the variation of magnitude, and not in the actual value of the magnitude.
So you can just enter a magnitude that is reasonable. Enter the value 12.0
and click
[OK] to close the Standard Data dialog. This automatically calculates
(or updates) the photometric zero point of the first image. The zero point replaces
any pre-existing zero
point and is applied to all measurements you have already made.
to enter Standard mode and move the mouse pointer onto the bright star at "1
o'clock" above Xanthippe. Click the mouse to mark the standard star. This
opens a dialog requesting the magnitude value for the standard star. In this
particular example, the magnitude is unimportant because we are interested
in the variation of magnitude, and not in the actual value of the magnitude.
So you can just enter a magnitude that is reasonable. Enter the value 12.0
and click
[OK] to close the Standard Data dialog. This automatically calculates
(or updates) the photometric zero point of the first image. The zero point replaces
any pre-existing zero
point and is applied to all measurements you have already made.
 After marking the standard star, the Photometry Measurements Report
Window shows 2 entries. The '*' in the Std? column indicates the standard
star we just marked:
After marking the standard star, the Photometry Measurements Report
Window shows 2 entries. The '*' in the Std? column indicates the standard
star we just marked:
Although
there are 23 columns of data in this Report, we are immediately interested only
in a few of the columns shown. Notice that the
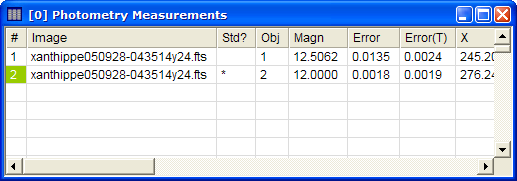 table contains two columns
labeled Error and Error(T).
The Error is the photometric error, or magnitude uncertainty, of the measurement.
The value of Error(T) is a theoretical calculation of the error at this magnitude,
for this object, in this image. The theoretical error provides a lower bound on the actual error at a
given magnitude.
table contains two columns
labeled Error and Error(T).
The Error is the photometric error, or magnitude uncertainty, of the measurement.
The value of Error(T) is a theoretical calculation of the error at this magnitude,
for this object, in this image. The theoretical error provides a lower bound on the actual error at a
given magnitude.
Photometry Messages
Also notice that the Photometry Message window looks like this, with 2 warning messages at the top and similar ones further down in the list:
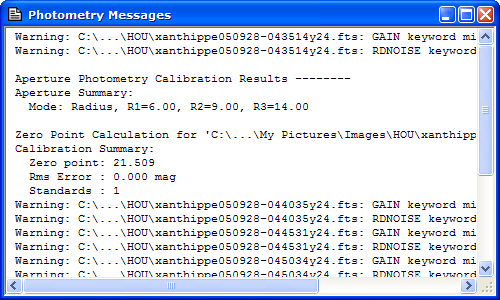 The
first two warning messages at the top of the window refer to the first image,
the image where we marked the objects. These messages inform you
that the image header does not contain entries for the instrumental gain and readout noise (GAIN and RDNOISE
keywords) that are used in converting pixel values to a magnitude and its error (see Aperture
Photometry). The values have been set to default numbers, but these do not give the correct value
for the photometric error. The warnings at the bottom were generated after you marked the standard star
and Mira did a recalculation of the photometric zero points in all images. The correct values for GAIN,
RDNOISE, and EXPTIME need to be in the image headers. The easiest way to do this is using the Info
page of the Photometry
Options dialog. This procedure is described in Fixing
Photometric Header Data. After correcting the values, Mira recomputes the photometric zero points
for all images and re-lists the results in the Report window.
The
first two warning messages at the top of the window refer to the first image,
the image where we marked the objects. These messages inform you
that the image header does not contain entries for the instrumental gain and readout noise (GAIN and RDNOISE
keywords) that are used in converting pixel values to a magnitude and its error (see Aperture
Photometry). The values have been set to default numbers, but these do not give the correct value
for the photometric error. The warnings at the bottom were generated after you marked the standard star
and Mira did a recalculation of the photometric zero points in all images. The correct values for GAIN,
RDNOISE, and EXPTIME need to be in the image headers. The easiest way to do this is using the Info
page of the Photometry
Options dialog. This procedure is described in Fixing
Photometric Header Data. After correcting the values, Mira recomputes the photometric zero points
for all images and re-lists the results in the Report window.
In many cases you will want to add more than 1 standard star or you may want to measure more than 1 object in the image. To do that, simply select the appropriate marking mode from the Photometry Toolbar and add objects in the same way we have already shown. In this case we only want 1 unknown (the minor planet Xanthippe) and 1 standard.
Extending the Measurements to Other Images
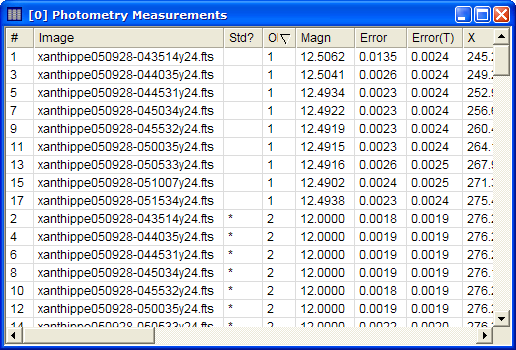
Now that all objects are marked in one image, you can extend the objects to all images. Click the tracking
button ![]() on the Photometry Toolbar. This tracks all objects from the current image into
all other images. The resulting measurements are displayed in the Report window
as shown below. At this point, you might also examine where Mira
on the Photometry Toolbar. This tracks all objects from the current image into
all other images. The resulting measurements are displayed in the Report window
as shown below. At this point, you might also examine where Mira
 tracked the
objects through the image set. You can do this using buttons or the scrollbar on
the Animation
Toolbar.
tracked the
objects through the image set. You can do this using buttons or the scrollbar on
the Animation
Toolbar.
Before capturing the window shown above, the table was sorted by clicking on the Obj (object number) column header to sort by object number. This groups together all measurements for each object number, placing together all measurements for object 1: the minor planet Xanthippe. This makes it easy to plot the magnitude versus time, as discussed in the next section.
Plotting the Magnitude
Next, let us plot the magnitude of Xanthippe versus Julian Date. This is easy to
do from data listed in the photometry report. We simply
mark the rows we want to plot, then use the Scatter
Plot command to select the
 table columns.
Marking particular rows requires Row Selection Mode. Right-click on
the table to open the Report
Context Menu. From the menu, select Selection Mode > Row. Then mouse
down on the first row and drag the mouse down until all rows are marked for object 1 (see Selecting
Cells in a Report Window and Making a Scatter Plot of Report Data). Then right-click inside the highlighted row region to open the menu
again and select Scatter Plot, as shown at
left.
table columns.
Marking particular rows requires Row Selection Mode. Right-click on
the table to open the Report
Context Menu. From the menu, select Selection Mode > Row. Then mouse
down on the first row and drag the mouse down until all rows are marked for object 1 (see Selecting
Cells in a Report Window and Making a Scatter Plot of Report Data). Then right-click inside the highlighted row region to open the menu
again and select Scatter Plot, as shown at
left.
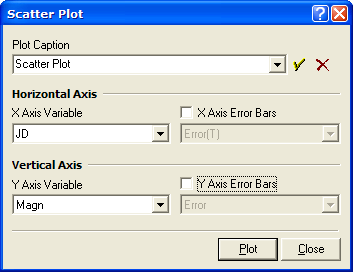
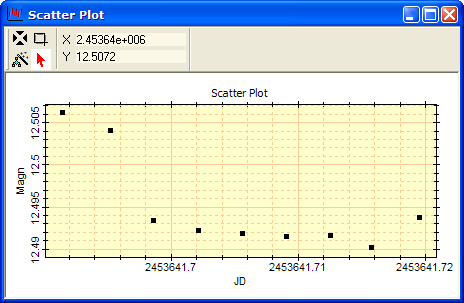
The Scatter Plot command opens the Scatter Plot dialog where the table columns are selected for plotting. Select "Magn" (Magnitude) for the Y Axis Variable and "JD" (Julian Date) for the X Axis Variable, as shown below, and click [OK]. We could also plot magnitude error bars using the Error or Error(T) data columns, but we will skip that detail here.
The scatter plot we have created needs one immediate change: magnitude plots are drawn with the Y-axis reversed,
so that a smaller number (brighter magnitude) is placed higher on the graph. Since the
Scatter Plot tool can plot anything against anything, but magnitude is backward,
it does not know this! So we need to change the Y-axis direction. On the Plot Toolbar, click
![]() to open the Plot
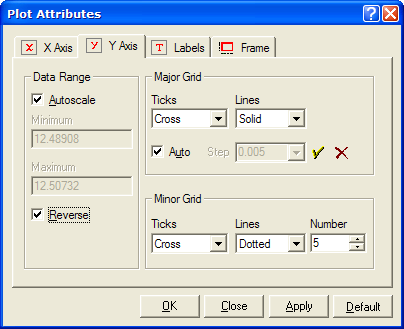
Attributes dialog and select the Y-axis page:
to open the Plot
Attributes dialog and select the Y-axis page:
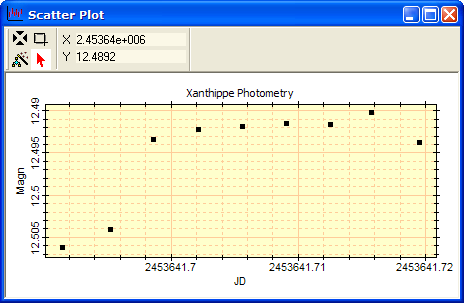
Check the Reverse option, as shown above, and click [Apply]. Next, select the Labels page and change the Plot Caption as shown below. On the Plot Attributes dialog, click [OK] to close the dialog and save your changes to the plot. These steps are shown below.
Does the Magnitude Vary?
Before answering our original scientific question, let's pause and notice that this is very good photometry. The consistency from image to image is quite good, being down near the 1 or 2 thousandths of a magnitude ("milli-mag") level. Why is it so good? Much of the credit is shared by Mira's exceptionally accurate centroid calculation for positioning on the objects and by its unique partial pixel algorithm that counts the signal from the object falling in partially filled pixels along the margin of the object measuring aperture (see Aperture Photometry). The remainder of the credit is due to Mira's accurate determination of the local sky brightness near each object. All these factors become critically important when attempting to measure astronomical objects with precision approaching the milli-mag level.
Before we can assess whether this object is varying in magnitude, we need to carefully investigate the data. Let's look carefully at the left-most 2 points. Notice that they are about 0.01 magnitude fainter than the other 7 points. Was the object really fainter in the first two images or is there another explanation? Stated another way, should we consider all 9 points equally valid? There is actually a sound reason why the first 2 points should be rejected. Look at the first 2 images in the image set. Notice that the sky measuring aperture overlaps the profile of a star. The overlap is small, but so is the 0.01 magnitude effect! Mira rejects obviously bad points from the sky aperture when using the Median or Modal brightness option (see the Other page of the Photometry Preferences dialog). But such a small addition of light is not detectable by software as something to be rejected. In the first two images, the brighter sky means that more signal is subtracted from the object which makes the object appear fainter — and that is precisely what the scatter plot shows. We may be wrong, but the safest action is to exclude the first two points and consider the 7 remaining points as "good" data.
On the Plot Toolbar, click ![]() to enter expand mode. Stretch a rubber band rectangle around the 7 points so that the total y axis range
is 0.01 magnitude. After you release the mouse button, the plot looks like the picture below.
to enter expand mode. Stretch a rubber band rectangle around the 7 points so that the total y axis range
is 0.01 magnitude. After you release the mouse button, the plot looks like the picture below.
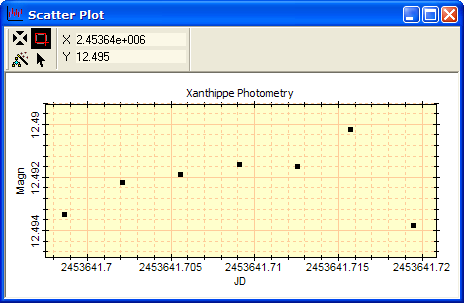 The
7 points we retained scatter about a constant value 12.4922 with an uncertainty of only 0.0009 magnitude!
From these results we cannot say that Xanthippe does not rotate or tumble, but we can say that these 30
minutes of data do not show light fluctuations large than 0.0009 magnitudes (a 1-sigma error). This is
an exceptionally precise measurement. You can use the Screen
Capture tool to copy this window (or just the graph) into a picture editor and
then paste it into your observing notebook.
The
7 points we retained scatter about a constant value 12.4922 with an uncertainty of only 0.0009 magnitude!
From these results we cannot say that Xanthippe does not rotate or tumble, but we can say that these 30
minutes of data do not show light fluctuations large than 0.0009 magnitudes (a 1-sigma error). This is
an exceptionally precise measurement. You can use the Screen
Capture tool to copy this window (or just the graph) into a picture editor and
then paste it into your observing notebook.
As an afterthought, suppose we did not like the aperture sizes used for
these measurements. These can be changed using the Aperture
Tool Window. To open the Aperture Tool, click
![]() on the Aperture Photometry Toolbar. This tool window is a shared resource used by whichever photometry
window is currently active). When you change the aperture description, Mira automatically re-measures
and updates the report table.
on the Aperture Photometry Toolbar. This tool window is a shared resource used by whichever photometry
window is currently active). When you change the aperture description, Mira automatically re-measures
and updates the report table.