Near Los Alamos, New Mexico, Dr. John Farrell studies variable stars using
Mira Pro 7 to do precision aperture photometry on large sets of CCD images. Dr. Farrell is a
 physicist who wants to focus on science rather than on how to stay awake
all night or how to tediously grind through 100's of images the next day. Yet his
work requires the type of processing sophistication that astronomers
usually associate with the "one image at a time" method. One of his
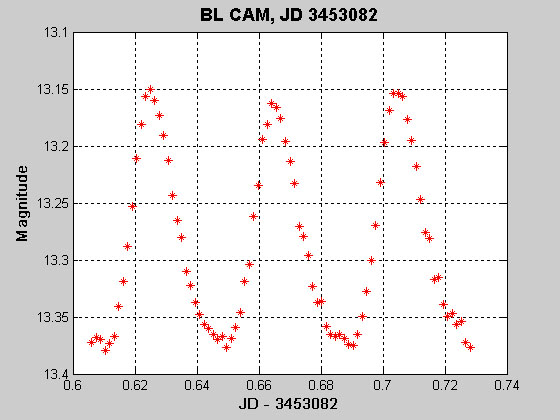
recent results is illustrated at left, in his light curve for the dwarf
Cepheid variable star, BL Camelopardalis.
physicist who wants to focus on science rather than on how to stay awake
all night or how to tediously grind through 100's of images the next day. Yet his
work requires the type of processing sophistication that astronomers
usually associate with the "one image at a time" method. One of his
recent results is illustrated at left, in his light curve for the dwarf
Cepheid variable star, BL Camelopardalis.
Dr. Farrell uses a combination of Mira Pro 7
for image processing with other software for camera and telescope control
to produce high-precision results
in a relatively automated fashion. At left, a processed CCD frame centered
on BL Cam is displayed in a Mira image window. 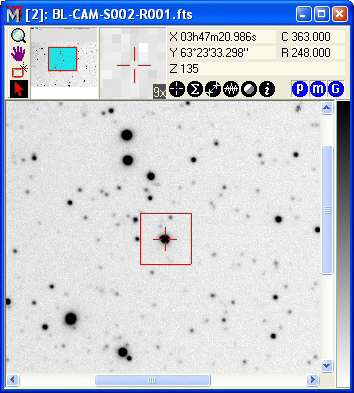 The light curve shown above
used
85 CCD frames like this, each of 120s exposure time, acquired on a
night of variable "seeing" (i.e., turbulent atmosphere). Some of the
scatter in the results is undoubtedly caused by the less than perfect
night. For calibration
purposes, another 60 bias and dark frames were used from images acquired a
few nights prior. Flat field frames were acquired on the same night as the science
data. These calibration frames were used to create master calibrations,
which were then applied to the science images, followed by aperture
photometry of stars in the final images.
The light curve shown above
used
85 CCD frames like this, each of 120s exposure time, acquired on a
night of variable "seeing" (i.e., turbulent atmosphere). Some of the
scatter in the results is undoubtedly caused by the less than perfect
night. For calibration
purposes, another 60 bias and dark frames were used from images acquired a
few nights prior. Flat field frames were acquired on the same night as the science
data. These calibration frames were used to create master calibrations,
which were then applied to the science images, followed by aperture
photometry of stars in the final images.
Astronomers often refer to image calibration as "data reduction", since the process of producing calibrated results reduces some billions of bits of raw data to something like 85 points on a light curve. Experienced observers know all too well the level of expertise and tedium required to perform the sophisticated data reduction steps that yield high precision results. But Mira gives users the flexibility to do data reduction at any level of sophistication, ranging from simple operations to complex ones, and from discrete steps to "black box" automation in which a button click transforms a folder of raw data into fully calibrated images ready for science. Dr. Farrell refined the processing procedure by critically analyzing calibration frames and intermediate results. Then he created two automated procedures, or "profiles" in Mira Pro; one profile creates all the master calibration frames and another profile applies the master calibration frames to the science data. Combined with other software that scripts the camera and telescope control, Dr. Farrell summarizes his observing program like this:
"The BL Cam light curve was incredibly easy and didn't take much more than 30 minutes of my time, including the image acquisition. ... I did the calibration in a folder without loading any images. ... The [Mira Pro] calibration scheme is so good that I won't be using IRAF for this any more."
As the end result, Mira Pro produced a table of precision aperture photometry measurements of BL Cam and 2 standard stars in the same field of view. To produce the light curve, he simply plotted the magnitude versus Julian Date from the table.
Dr. Farrell uses an Apogee Instruments AP-2 CCD camera with Kodak CCD and a 0.4m Ritchey-Cretien optical assembly on a Software Bisque Paramount mounting. The image acquisition is controlled by Maxim DL and Pinpoint ACP3 software. Using this equipment, a night of data collection yields a folder full of raw images on the observatory computer's hard drive. For the results shown here, Dr. Farrell describes his Mira Pro session thusly:
"This morning I copied the [raw image] folder into my desktop computer, launched Mira, ran two calibration profiles, loaded the processed image set, and ran the photometry. I doubt this took 10 minutes."
 Dr.
Farrell's calibration procedure involves sophisticated tasks such as
overscan bias correction and elliptical aperture photometry, but Mira Pro
handles them as easily as it does simpler, "quick look" methods that
produce less precise results. Image
Calibration
Dr.
Farrell's calibration procedure involves sophisticated tasks such as
overscan bias correction and elliptical aperture photometry, but Mira Pro
handles them as easily as it does simpler, "quick look" methods that
produce less precise results. Image
Calibration
Mira Pro 7 reduces the complexity and tedium of getting exceptional results. As Dr. Farrell says, "I no longer have to...spend hours slogging through the routine calibration stuff manually so I am free to work with the finished data, which is where the science is."
Further information
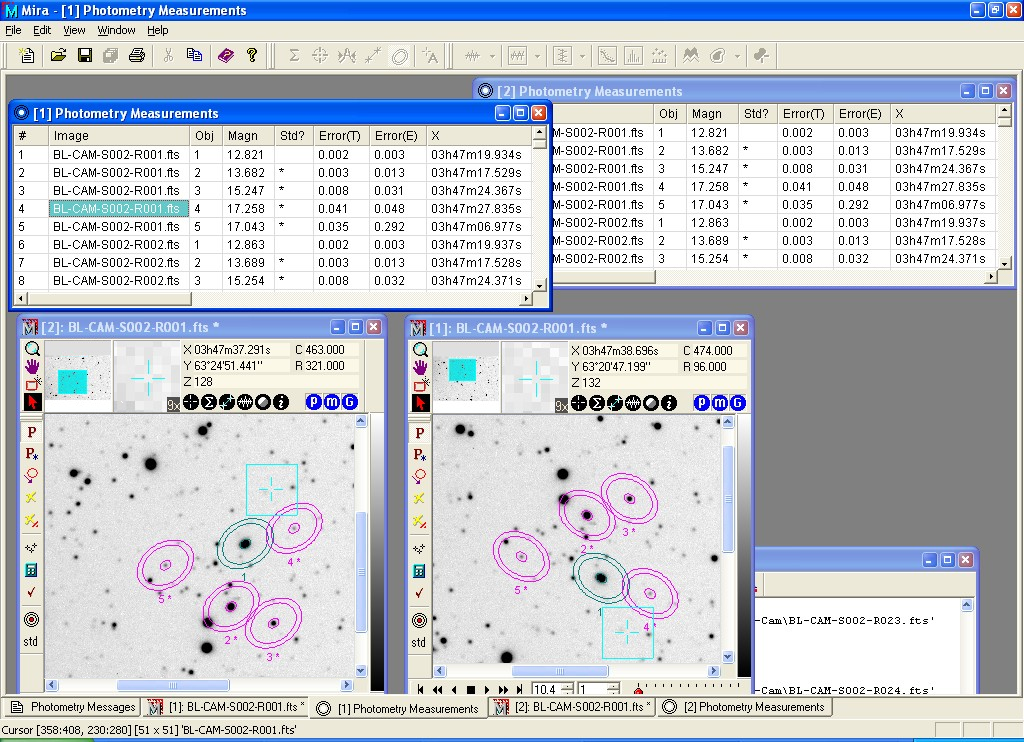 This
screen shot (be sure to view at 100% size) shows Mira Pro doing photometry
of 2 images sets, each with 25 FITS images. The images have a FITS WCS
calibration (or "plate solution") which allows catalog
processing based on a text database file containing (RA, Dec) of target
objects and standards. The objects
were automatically tracked through the image stack by transformed to
from a catalog file (text format) and automatically measured in 25 images.
There are two ways to display a FITS image: "conventional", and with the
rows increasing downward. You can see that the results
are identical, meaning that the aperture orientation accounts for the
display direction so that the same pixels are measured.
This
screen shot (be sure to view at 100% size) shows Mira Pro doing photometry
of 2 images sets, each with 25 FITS images. The images have a FITS WCS
calibration (or "plate solution") which allows catalog
processing based on a text database file containing (RA, Dec) of target
objects and standards. The objects
were automatically tracked through the image stack by transformed to
from a catalog file (text format) and automatically measured in 25 images.
There are two ways to display a FITS image: "conventional", and with the
rows increasing downward. You can see that the results
are identical, meaning that the aperture orientation accounts for the
display direction so that the same pixels are measured.