Plot Toolbar
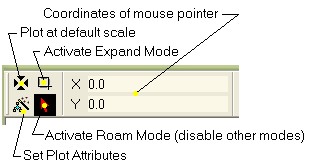
The Plot Toolbar provides user interface connections to frequently used commands for adjusting the appearance of plotted data. It also displays the coordinates of the mouse pointer as it moves over the plot.
The toolbar functionality is duplicated in the Cursor Mode submenu of the Plot Context Menu. This is handy if you do not want to lose your visual context looking at the plot or if you have the Plot Toolbar undocked or disabled. To cause the Plot Toolbar to be shown or hidden in new Plot Windows, use the checkbox on the Plot Preferences page.
The controls on the Plot Toolbar are described in the following table.
|
|
Re-plots the data at the default scale. The x- and y-axes are autoscaled to fit all the data within the plot space. |
|
|
Activates Expand Mode. In this mode you rubberband a rectangle around a region of data you wish to enlarge. Disable Expand Mode by clicking the Roam button. |
|
|
Activates Roam Mode. This disables all other command modes for the Plot Window. |
|
|
Opens the Plot Attributes dialog from which you can change the axes, labels, caption, plot frame and other attributes. |