Plotting Examples
Below are shown some examples that illustrate the image plotting capabilities of Mira AP.
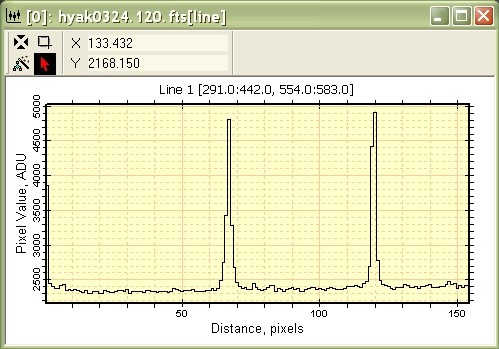
The figure below shows a simple Line Profile plot in Pixel Coordinates.
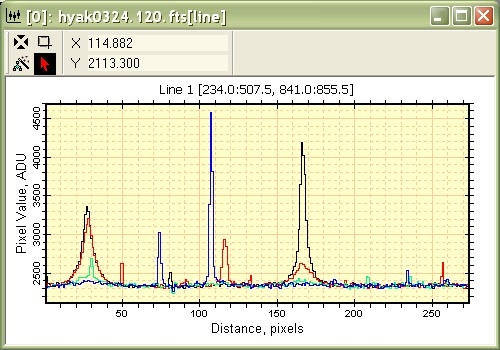
The following example shows a Line Profile with several over-plotted Plot Series created from data along lines parallel to the first line.
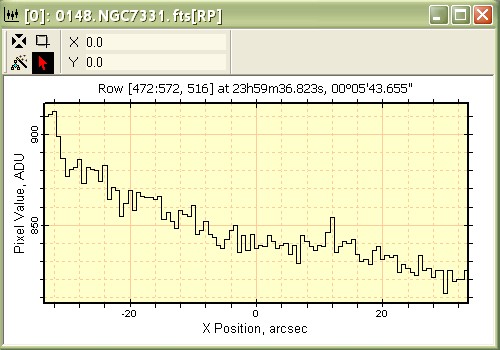
The figure below shows a Row Profile from an image with a World Coordinate System calibration.
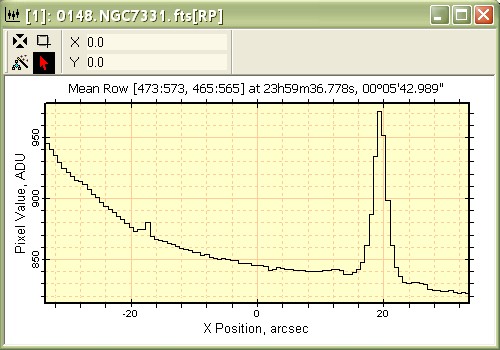
The next figure below plots an Average Row sampled over 101 rows and using world coordinates.
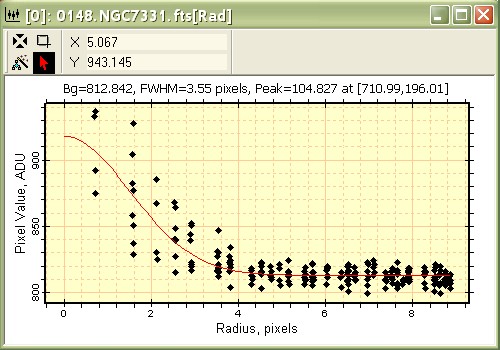
The following plot shows a Radial Profile plot with the FWHM value calculated from a fit to a point in the image data.