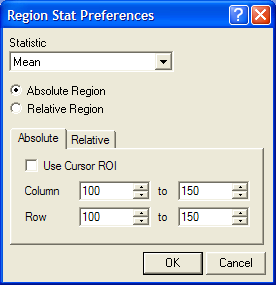
Region Stat Preferences
The Region Stat Preferences dialog configures the computation of a region statistics. This is usually done for computing a normalization factor, as for the Combine Images command. In that application, the normalization values are obtained for the set of images using the statistic selection and the reference region specified in this dialog.
The statistic is the value that is calculated to characterize the values in the reference region. The statistical method is selected from the listbox at the top of the dialog (here, the Mean method is selected, so Mira will compute the mean value of the reference region):
![]()
The statistics options are described in Region Statistics Methods. As described in the following section, there are various ways to specify the region that Mira uses for calculating the statistic.
The statistic is computed inside a reference region consisting of a rectangular area of pixels. Choosing the correct region is as important as choosing the correct statistics to measure.
The page for Absolute Region preferences is shown below. Choose this method if you want the to specify exact edge coordinates for the reference region.
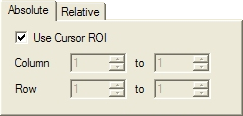
There are two ways to choose the column and row limits of the region:
Cursor ROI checked: Mira ignore the column and row settings in the dialog and uses the bounds of the Image Cursor when the parent command needs to compute the normalization. This allows you to visually adjust the cursor to enclose the region you want to use.
Cursor ROI not checked: Mira ignore the Image Cursor and uses the specific column and row limits entered into this dialog.
You can see that the term "absolute" means that the column and row boundaries are specified by you (entered into the edit fields in one case and visibly chosen in the other case).
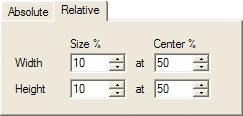
The page for Relative Region is shown below. You can see that the region bounds are not directly specified. Instead, we use relative positions as percentages of the image dimensions.
|
|
|
The Size % preference is based upon percentage of the image size. For example, a value of 10 indicates that the normalization rectangle extends 10% of the image width or height, whichever is the case. It does not matter how large the image may be. In this example, the normalization rectangle always covers 10% of the image dimension.
The Center % preference defines the central position of the references region as a percentage of the image size. For example, a value of 50 indicates that the normalization rectangle is centered at 50% of the image width or height, whichever is the case. It does not matter how large the image may be. In this example, the normalization rectangle is always centered at 50% of the image dimension.