Plot Copy & Paste Example
The windows below show an application of the copy/paste procedure to compare the values in a single row with the mean and median rows measured over adjacent neighboring rows.
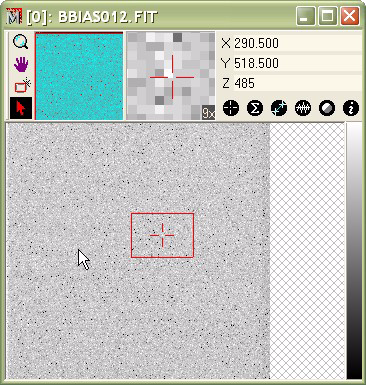
The figure below shows the image that will be plotted. This is a CCD Bias Frame which shows primarily random noise. The region of interest is defined by the position and extent of the rectangle cursor.
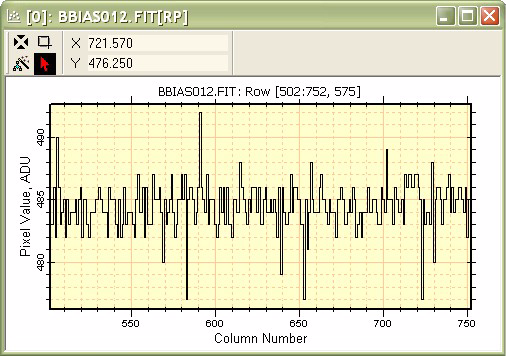
The next window, below, shows the central row of
the image cursor plotted using the ![]() (Single Row) command.
(Single Row) command.
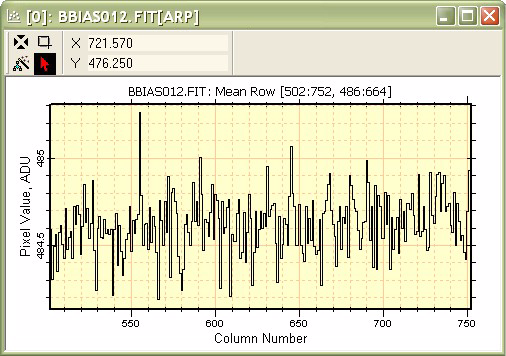
The figure below shows the mean row value for rows inside the region of the Image Cursor. The Mean collapse method was selected using the Combine Mode > Mean command in the Image Context > Plot menu. Notice that the y-axis shows a much smaller range than for the single row plot, above. This plot is in a separate window from the other plot.
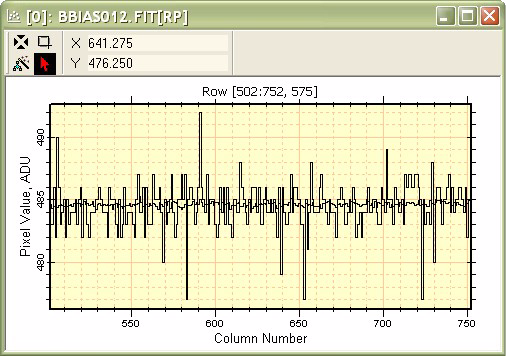
The next figure shows the result of using the Copy/Paste protocol. The Copy command was applied to the window showing the single row plot, then the target window was activated and the Paste command was executed. The resulting plot clearly shows the difference in noise levels between the single row and the mean row.
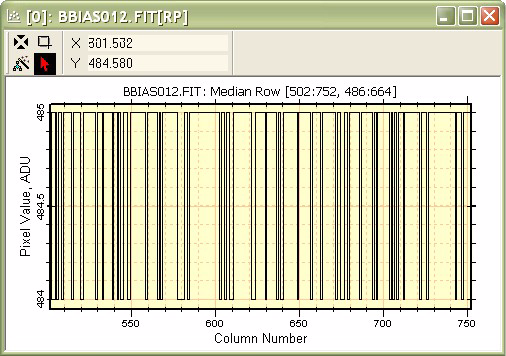
Next, the Combine Mode was changed to Median using the Plot menu command. The resulting median row plot is shown in the window. Notice that the median row jumps between integral pixel values, which is as would be expected for an image of almost pure noise.
In the next figure, the median row, shown above, is added to the window containing the previous pasting operation. This makes 3 plot series in the window, which compares the single row with the mean and median value of neighborhood rows.

To work with the data further, you may wish to access the actual data in the 3 plot series. To do this, use the Series Data command in the Plot menu or Plot Context Menu. The data can be copied to the clipboard or saved from this dialog to a text file for use by other application software.

Copy (Ctrl+C), Paste (Ctrl+V), Coping & Pasting Plot Data