3-D Z-Scaling Examples
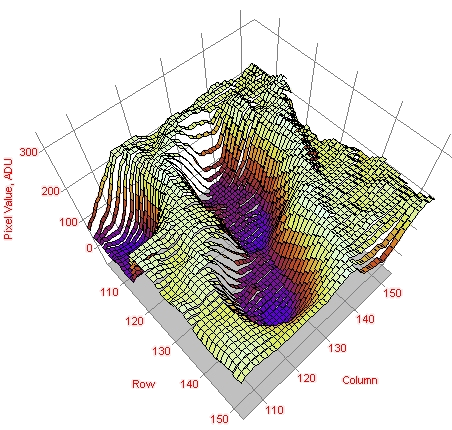
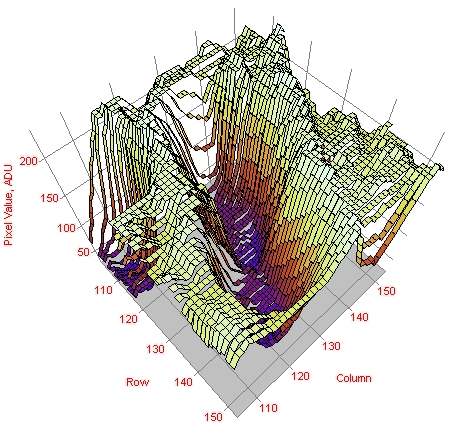
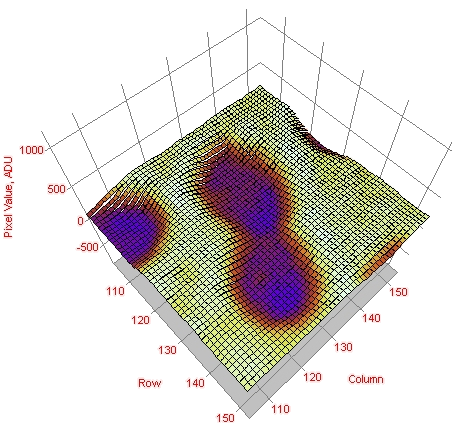
The pictures below show the effect of adjusting the Z-Scaling slider on the right border of the 3-D Plot Window. (This illustration uses the Ribbon Plot pixel representation; see 3-D Drawing Attributes).
3-D Plot shown using the default setting for the Z Scale slider. This stretched the plot to approximately 70% the height of the data cube.
Plot appearance with Z Scale slider adjusted to maximum setting. This plots the data using 100% the height of the data cube.
Plot appearance with Z Scale slider adjusted to minimum setting.
Mira Pro x64 User's Guide, Copyright Ⓒ 2023 Mirametrics, Inc. All
Rights Reserved.