Examples of Adding Series to a Line Profile Plot
The figures below show an example of adding plot series to a Line Profile. The first plot was made using Draw Mode and subsequent plot series were made using Move Mode with Move Perpendicular enabled. When more than 1 plot series is displayed in a Plot Window, you can use the Plot Animation Bar to step between or animate the series.
First, create a plot using Draw Mode on the Line Profile toolbar.
Next, change to Move mode with Move Perpendicular enabled. This creates another plot series. Both series are shown here, in Overplot mode.
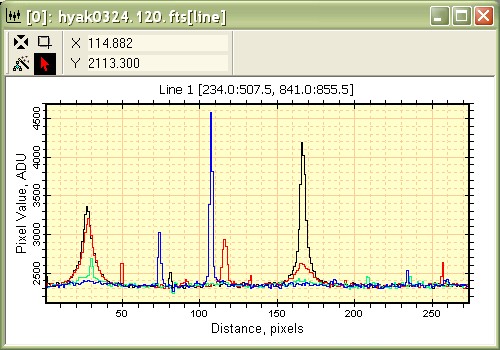
The picture below shows the Plot Window after 4 series are added to the original, making 5 series in total:
The examples above use color cycling to distinguish the plot series. You can change the plot series colors, the cycling interval, or make them identical, using the Plot Properties.
Plot Properties page, Plot Animation Bar
Mira Pro x64 User's Guide, Copyright Ⓒ 2023 Mirametrics, Inc. All
Rights Reserved.