Histogram Properties
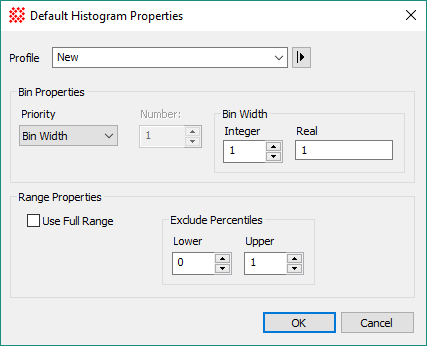
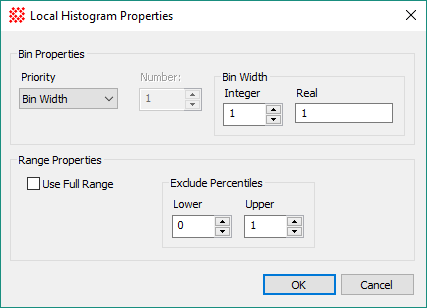
Histogram Properties control histogram plots. These properties can be changed globally, to make default settings for new image windows, or locally, to affect histogram plots only made from a specific window. The default properties dialog uses a profile control to save and recall parameter sets for use by future image windows. Local properties affect only the specific Image Window for which they are changed.
Open these dialogs using the View > Default Properties > Histogram command and the View > Local Properties > Histogram command..
|
Histogram Properties |
|
|
Profile [|>] |
Selects the parameter profile for this command and allows you to save or work with existing presets. |
|
Bin Properties |
|
|
Priority |
Specifies which properties are given priority. Automatic: Mira chooses optimal settings for both the bin width and the number of bins. Bin Width: You choose the bin width and Mira calculates the number of bins. There is one setting for integer type images and another setting for real type images, as integer type data should not be binned using a non-integral bin width. Bin Count: You choose the number of bins and Mira calculates the bin width. |
|
Number |
Specify the number of bins when Bin Count priority is selected. Mira calculates the bin width. |
|
Bin Width |
Specify the bin width when Bin Width priority is selected. Mira calculates the number of bins. There is one setting for integer type images and another setting for real type images, as integer type data should not be binned using a non-integral bin width. |
|
Range Properties |
|
|
|
The frequency distribution uses the full range of values encountered in the sample. The number of bins and the bin width are applied to the full range. |
|
Exclude Percentiles |
Upper: This setting specifies the upper percentile of values to be excluded from the binning process. For example, 1.0 specifies that the highest 1% of the values are excluded. Lower: This setting specifies the lower percentile of values to be excluded from the binning process. For example, 0.5 specifies that the lowest 0.5% of the values are excluded. |
The histogram bin is the "quantum" of the x axis data in the plot. Each bin spans a range of image value so that pixels with value anywhere inside the limits of the bin are assigned to that bin. Their detailed values are lost in the plot. Choosing the bin width (or range of values) and the number of bins affects the way the data are displayed. The bin setting is a priority for generating the frequency distribution, because the other aspects follows. For example, setting the bin width affects the number of bins that are needed to span the range of the data. Conversely, choosing the number of bins controls the width of the bins. Mira provides 3 choices for setting the histogram bin priority:
|
Histogram Bin Priority Options |
|
|
Automatic |
Mira chooses optimal settings for both the bin width and the number of bins. |
|
Bin Width |
You choose the bin width and Mira calculates the number of bins. There is one setting for integer type images and another setting for real type images, as integer type data should not be binned using a non-integral bin width. |
|
Bin Count |
You choose the number of bins and Mira calculates the bin width. |
The histogram range refers to the range of data values included in the histogram. Mira offers the option to use all the data or to select a range of upper and lower percentiles to exclude from the histogram. If the data are "well behaved" then you might choose to see the full range of data. Otherwise, you can exclude the extreme values to show more detail in a specific range of the frequency distribution.
Setting Application Properties
Tutorial: Creating Plots from Images
Mira Pro x64 User's Guide, Copyright Ⓒ 2023 Mirametrics, Inc. All
Rights Reserved.