![]() Interactive
Contour Plot
Interactive
Contour Plot
The Interactive Contour Plot command interactively marks intensity contours on an image. It operates from Interactive Contour Plot Toolbar. The contour follows a path of constant intensity, perpendicular to the local gradient. This is a point & click tool in which you click the mouse on the point having the intensity at which you want to create a contour. The related Contour Plot command plot contours non interactively using one or more specified levels.
Open the Interactive Contour Plot Toolbar
using the Plot > Interactive Contour command from the
top-level Image menu or the ![]() button on the
Image Plot Toolbar.
button on the
Image Plot Toolbar.
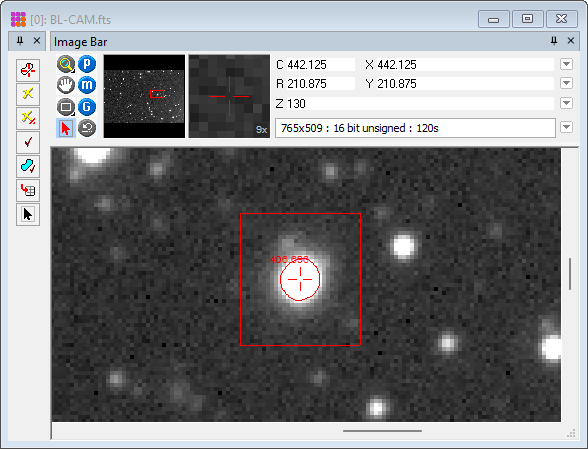
The contour may be generated inside the Image Cursor or you can contour the entire image. There are a number of Properties that control generation and display of the contours. Be advised that contouring the entire image by clicking on noise can take a very long time to compute.
|
Tip |
You can terminate the contour computation at any time by hitting the [Esc] key. This is especially handy if you start a contour computation after accidentally clicking on a level far into the noise. |
Interactive contour plotting uses the Interactive Contour Plot Toolbar shown below. This is opened from the top-level Image Plot Toolbar. or the Plots > Contour Toolbar.
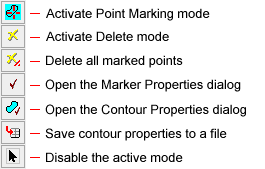
To interactively mark contours, enable marking mode by pressing the top toolbar button, then click on the image to compute the contour.
To set Contour Drawing Properties for the contour
generation, click ![]() on the toolbar.
on the toolbar.
To set Interactive Contour Properties click ![]() on the toolbar.
on the toolbar.
In regions of high noise, you can reduce noise tracking by increasing the contour smoothing. For more information about contour plotting in noisy areas of an image, see Contour Plotting with Various Levels of Smoothing.
|
Note |
It is usually advisable to constrain the contour to a rectangle inside the image cursor. Contours require drawing many short lines, and a complex contour containing a large number of line segments may cause the computer to lag every time the image window needs to be redrawn. |
With many complex contours visible, display
updating can be sluggish on slower computes. On a given computer,
you can speed up re-drawing time try the following solutions:
increase smoothing, confine the contours to a rectangle of smaller
size, or delete the contour using the ![]() (delete all) button on the
toolbar.
(delete all) button on the
toolbar.
Interactive Contour Properties
Mira Pro x64 User's Guide, Copyright Ⓒ 2023 Mirametrics, Inc. All
Rights Reserved.