Plotting Images and Data
Mira provides tools for plotting images in various 1-D and 3-D formats, including intensity profiles, line cuts, histograms, radial intensity profiles, contours, and surface plots. Tools are also provided for plotting data tabulated in the Grid Control of a Report Window or Measurement Pane. These commands originate in the Image Plot Toolbar, Grid Command Menu, and other menus.
|
Plotting Topics |
|
|
Column Profile (vertical) |
|
|
Row Profile (horizontal) |
|
|
Line Profile (arbitrary direction) |
|
|
|
|
Mira provides several ways to display data in the form of a graph. For this, Mira AL x64 provides both the Plot window interface and the Chart window interface as shown below. Plots are often created to show the relationship between image luminance and position, known as a Profile Plot, but several other plot types are available for images. Click here to view examples plotting image data.
A Profile Plot is a graph of pixel values along a line through an image. This line may be parallel to the column direction, parallel to the row direction, or along an arbitrary direction. These are referred to as a Column Profile, Row Profile, and a Line Profile, respectively. Mira can plot not just a line of row or column data but also an average column or row or all columns or rows. In addition, if an image set is opened, you can choose to plot these quantities for every image in the set. Mira can create plots showing data in the following forms.
Several of these commands can be operated using a single keystroke command.
The Column Profile command graphs image luminance along an image column.
The Row Profile command graphs image luminance along an image row.
The Radial Profile command graphs luminance versus distance in all directions around a point in an image.
The Line Profile command graphs image luminance along an arbitrary drawn line.
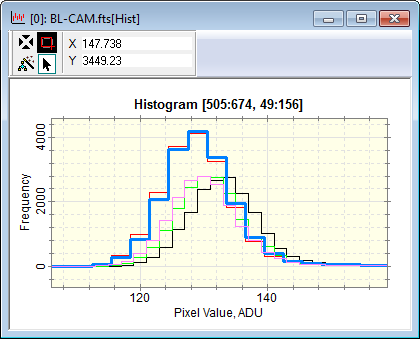
The Histogram command graphs the frequency of occurrence of different luminance values.
The following commands work with table data in a Grid Control:
The Create Plot from Table Data command plots two columns of data from the table into a Plot Window.
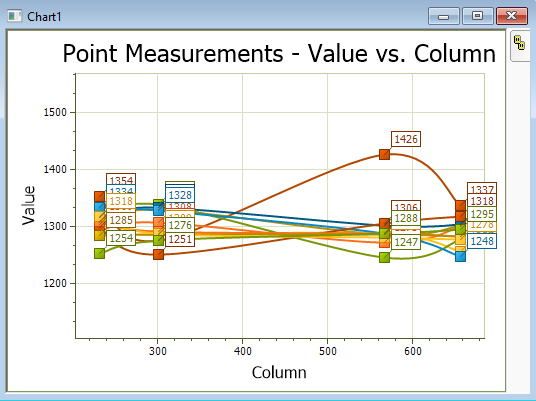
The Create Chart from Table Data command plots two columns of data from the table into a Chart Window.
Plot and Chart Name Suffixes
|
[CP] |
Column Plot along a single column in one or more images. |
|
[RP] |
Row Plot along a single row in one or more images. |
|
[ACP] |
Average Column Plot along an average of parallel columns in one or more images. |
|
[ARP] |
Average Row Plot along an average of parallel rows in one or more images. |
|
[Line] |
Line plot along a general direction. |
|
[Hist] |
Histogram Plot |
|
[Rad] |
Radial Profile Plot |
|
ChartN |
Chart windows use an auto-incrementing name based on "Chart" and a number N, starting with Chart1, then Chart2, Chart3, and so on. |
Contents, Plotting Examples, Examples of Row Plots, Plot Windows, Chart Windows, Plotting Commands, Plot Coordinate System, Plotting an Averaged Line, Plot Series Data, Create Plot from Table Data, Create Chart from Table Data, Image Tool Keystroke Commands