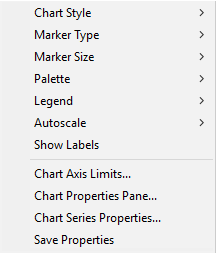
Chart Command Menu
The Chart Command Menu provides commands for changing the data presentation and setting window properties.
Open the Chart Command Menu by right-clicking inside the Chart Window.
|
The Create Chart Command Menu |
|
|
Graph Style |
Changes the type of graph that is displayed: Markers: Creates a scatter plot using markers. Markers with Lines: Creates a scatter plot using markers connected by lines. Markers with Splines: Creates a scatter plot using markers connected by splines. Bars: Creates a bar plot. Area: Creates an area plot. Area with Splines: Creates an area plot with values connected by splines. |
|
Marker Type |
Selects the marker type. |
|
Marker Size |
Selects the marker size. |
|
Palette |
Selects the color scheme for markers, lines, and areas. |
|
Legend |
Selects legend properties using the Chart Legend Properties dialog. |
|
Show Labels |
Enables or disables labels showing Y-Value for each point. |
|
Chart Axis Limits... |
Opens the Chart Axis Limits dialog for specifying one or more of the axis limits for the plot inside the chart window. |
|
Chart Properties Pane... |
Opens the Chart Properties Pane for specifying the general properties of the chart. |
|
Chart Series Properties... |
Opens the Chart Series Properties dialog for specifying the properties of individual data series plotted in the chart. |
|
Save Properties |
Saves the current properties for future charts. |
Chart Windows, Chart Legend Properties, Chart Series Properties, Chart Properties Pane, Chart Axis Limits, Create Chart from Table Data, Plotting Images and Data