Chart Properties Pane
The Chart Properties Pane is used to change the properties of the chart after the chart is created. This docking pane can be altered like all panes, for example by reducing it to a tab on the chart window border.
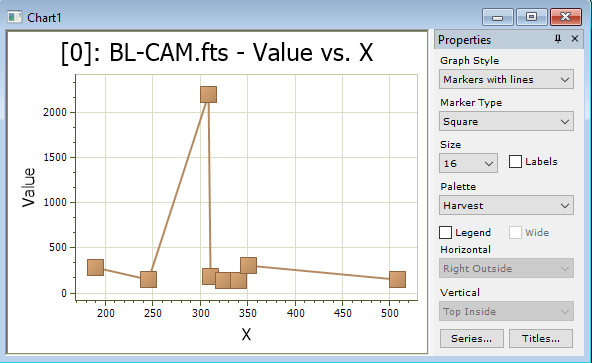
The Chart Properties Pane is opened from the Chart Command Menu.
|
Properties of the Chart Properties Pane |
|
|
Graph Style |
Selects the type of graph to be created: Markers: Creates a scatter plot using markers. Markers with Lines: Creates a scatter plot using markers connected by lines. Markers with Splines: Creates a scatter plot using markers connected by splines. Bars: Creates a bar plot. Area: Creates an area plot. Area with Splines: Creates an area plot with values connected by splines. |
|
Marker Type |
Select the marker from the selections in the drop box. |
|
Size |
Select the marker size from the selections in the drop box. |
|
|
Check this box to show Y-Value labels for each point. |
|
Palette |
Select the point, line, and area color scheme from selections in the drop box. |
|
|
Check this box to display a legend on the chart. |
|
|
Check this box to display a horizontally directed legend. |
|
Horizontal |
Select the horizontal legend location from selections in the drop box. The "Inside" and "Outside" options relate to the horizontal position of the chart box limits. |
|
Vertical |
Select the vertical legend location from selections in the drop box. The "Inside" and "Outside" options relate to the vertical position of the chart box limits. |
|
Series |
Click this button to open the Chart Series Properties dialog. |
|
Titles |
Click this button to open the Chart Titles dialog. |
Chart Windows, Chart Command Menu, Chart Legend Properties, Chart Axis Limits, Chart Series Properties, Create Chart from Table Data