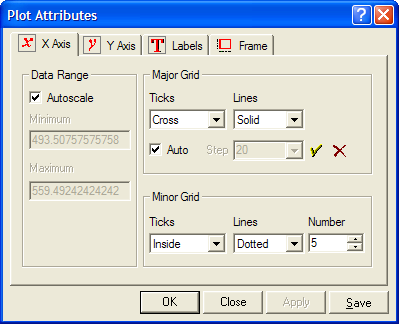
X-Axis Attributes
The X Axis Attributes page allows you to configure the horizontal (x) axis of a plot in a Plot Window. Use this page to change the number and style of tick marks and set the axis extent.
To open the X-Axis Attributes page, open the Plot Attributes dialog and select the X Axis tab.
|
Autoscale |
Check this box to scale the x-axis limits to the full range of the data. |
|
Minimum |
If Autoscale is unchecked, this specifies the minimum value on the x-axis. |
|
Maximum |
If Autoscale is unchecked, this specifies the minimum value on the x-axis. |
|
Ticks |
Specifies how tick marks are drawn at major divisions of the x-axis. |
|
Lines |
Specifies how lines are drawn inside the plot box at major divisions of the x-axis. |
|
Auto |
Check this box to let Mira choose the spacing of major intervals on the x-axis. |
|
Step |
If Auto is unchecked, this specifies the value interval between major divisions of the x-axis. |
|
Ticks |
Specifies how tick marks are drawn at minor divisions of the x-axis. |
|
Lines |
Specifies how lines are drawn inside the plot box at minor divisions of the x-axis. |
|
Number |
Specifies the number of minor divisions per major division on the x-axis. |
|
tip |
A new plot is created with the x-axis automatically
adjusted to the full range of the data. This is the same as
checking the Auto option in this
dialog. If you uncheck Auto and enter
new limits, you can can return to the autoscaled values by clicking
the |