Comparison of Histogram Preferences
The Histogram Preferences page provides controls to change the way the image data are binned into the histogram plot. The screen-shots below show the result of varying the parameters on the same sample of image data. This shows a sample of about 4000 pixels from an integer type image in which the sample includes a small number of very high pixels.
After selecting a target image, the following sequence of commands was used to create this example:
The image window was brought to the top of the window stack. The Cursor Mode was activated using Ctrl+D. The pixel sample was selected by adjusting the position and size of the image cursor. Then Ctrl+D was used to switch out of Cursor Mode to avoid accidentally moving the image cursor during the tests.
The Mira Preferences dialog was opened using Ctrl+R. Options were set on the Histogram page.
The [OK] button was clicked to close the Mira Preferences dialog. This saves the changes for the current image window.
The histogram was plotted.
This procedure was repeated for each different plot without changing the location of the image cursor. The results are given below:
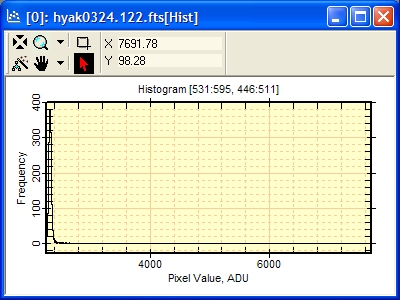
Bin Priority: Automatic.
Range: Full Range.
Only 1 or a few points of extremely high value push the majority of data into a small number of bins at the left.
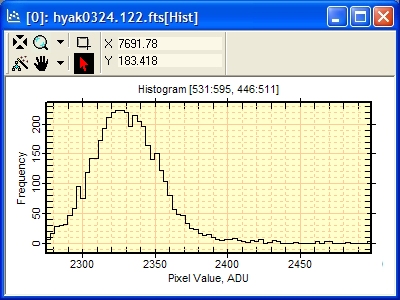
Bin Priority: Automatic.
Range: Exclude lower 0.5% and upper 1.0%.
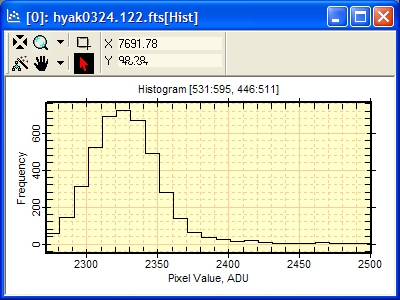
Excluding the extreme values from the data sample allows auto binning to show more relevant information in the central portion of the frequency distribution.
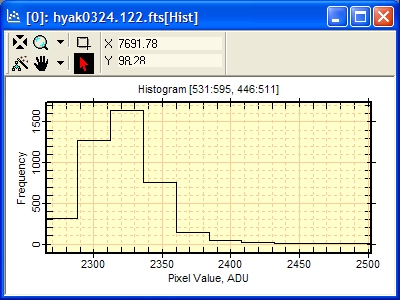
Binning: Bin Count=10.
Range: Exclude the lower 0.5% and upper 1% of data.
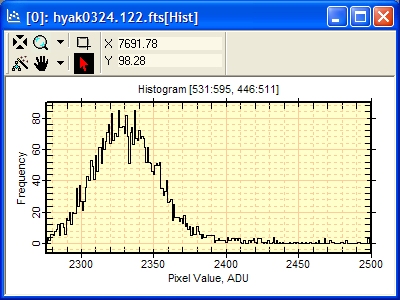
Binning: Bin Width=10.
Range: Exclude the lower 0.5% and upper 1% of data.
Binning: Bin Width=1.
Range: Exclude the lower 0.5% and upper 1% of data.