![]() Histogram
Plot
Histogram
Plot
|
|
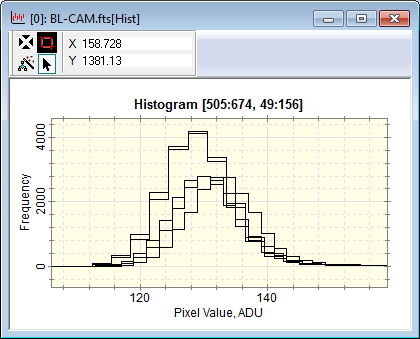
A typical histogram plot is shown at left. This example shows the histogram of 5 images in an image set, Overplotted, with the second image shown in red. The binning and range of the histogram can be set beforehand using the Histogram preferences page of the Mira Preferences dialog (Ctrl+R). |
A histogram plot graphs the frequency distribution of image values. This plots the number of occurrences of values within a range of value, called a "bin". For the histogram plot, Mira samples the pixels inside a rectangle defined by the Image Cursor. For luminance data (non RGB), Mira can choose the bin width and number of bins or use values you specify. For RGB data, Mira uses 256 bins of width 1.
Adjust the Image Cursor to enclose the sample region.
Set histogram binning and range using
Ctrl+R or the Preferences command
in the Histogram Drop Button menu, ![]() .
.
Use the Plot > Histogram menu command
or click the ![]() button.
button.
Mira provides tools for modifying the histogram and plotting parameters before the data are binned into a histogram. Although some plot aspects can be changed after the plot is created, the binning must be established before generation of the data that are plotted.
The histogram binning and range parameters must be set before a plot is created. Use the Histogram page of the Mira Preferences dialog. See the example showing the difference the histogram settings.
The default attributes (line thickness and color) may be configured using the Plot page of the Mira Preferences dialog (Ctrl+R).
The Series Attributes (line thickness and color) can be changed after the histogram is plotted. Use the Plot Series Attributes command (Ctrl+R).
The Histogram button on the Plot Toolbar has a drop arrow button which opens a menu of Histogram related commands, like that shown here:
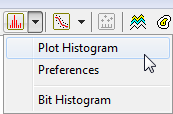
These menu items execute the present command, open the Histogram Preferences dialog, and plot a Bit Histogram
Plotting Commands, Plot Windows, Plot Attributes, Histogram Preferences