![]() Statistics
Measurements
Statistics
Measurements
The Statistics Measurement tool is used to compute basic statistics within a rectangular region of an image.
To make a Statistics measurement, adjust the
Image Cursor to
enclose the target region, then click the ![]() button or use the Measure > Statistics
command from a menu.
button or use the Measure > Statistics
command from a menu.
This command uses the Image Cursor to permit profile plots within the same region without having to re-position.
If an image set is open in the Image Window, you can choose whether to measure only the active member of the image set or to compute the Statistics for the entire image set.
Measurements are tabulated in the Statistics Measurements window as shown below. This is a Report Window with built-in functionality for sorting, rearranging, copying, and saving to a file.
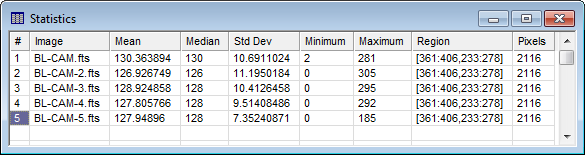
Measurements for all regions in all images and all Image Windows go into a single Report window. If you want to clear the Report window of prior measurements, make sure the window has focus, then click Clear in the View pull-down menu.
The items in the Report window are described in the table below.
Statistics Quantities
|
# |
The sequence number of the measurement. |
|
Image |
The name of the image that was measured |
|
Mean |
The mean value of pixels inside the region. |
|
Median |
The median value of pixels inside the region. |
|
Std Dev |
The standard deviation of values inside the region. |
|
Minimum |
The minimum value inside the region. |
|
Maximum |
The maximum value inside the region |
|
Region |
Description of the pixel region that was measured. This description uses the following format: [MinCol:MaxCol, MinRow:MaxRow] |
|
Pixels |
The pixel count inside the region. |