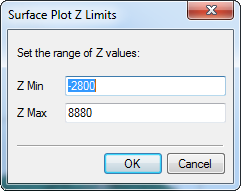
Open the Surface Plot Z Limits dialog from the View > Z Range > Set Limits menu command, set the desired values, then click [OK].
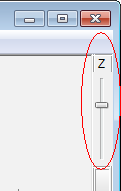
Adjust the slider located in the upper right corner of the 3-D Plot window
Surface Plot Z Limits
The Z Limits of the 3-D plot define the upper and lower values at the top and bottom of the 2-D plot. There are two ways to change the Z limits, as shown below. You can return to an autoscaled 3-D plot using the View > Z Range > Autoscale command.
|
|
|
|
|
Open the Surface Plot Z Limits dialog from the View > Z Range > Set Limits menu command, set the desired values, then click [OK]. |
|
Adjust the slider located in the upper right corner of the 3-D Plot window |