3-D Plot Windows
3-D Plot Windows display a 3-D surface of 2-D image data. The , which is often a plot of image luminance versus position. The topic 3-D Pixel Representations shows how a 2-D image can be rendered various ways in 3-D for a better view of the data. You can control whether Mira prompts you to confirm closing a 3-D Plot Window using the check list item in the Other Preferences dialog.
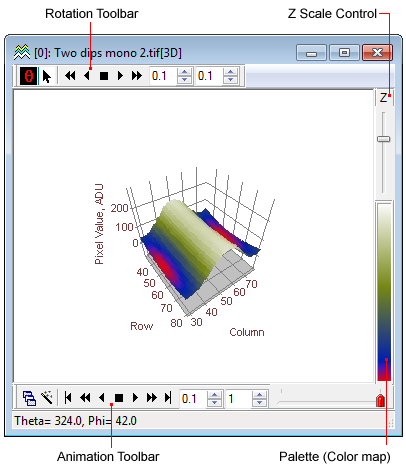
The diagram below shows the general 3D Plot window. In this case, an image set is plotted, making the Animation Toolbar visible at the bottom of the window. This toolbar that provides controls for plot sequencing. The Rotation Toolbar at the top is generally available for any 3-D plot.
The Rotation Toolbar controls rotation of the rendered data. This is similar in function to the Plot Animation Toolbar except that this toolbar adjust parameters for rotation rather than for changing between plot series.
The 3-D Animation Control Toolbar toolbar works with multiple 3-D plots created from an Image Set displayed in an Image Window. when an image set is displayed in an image Windows, use the [G] button or the Plot Image Set command to choose whether to render in 3-D only the current image or the entire image set. If you render the image set, then this toolbar is automatically opened.
Like Image Windows, 3-D Plot Windows have a Colormap on their right border. This shows the mapping of palette entries to display levels for the rendered surface. Also as for Image Windows, you can change the palette mapping by stretching the palette using the Colormap or the Palette Properties dialog.
To stretch the palette from the Colormap, move the arrow over the Colormap, mouse down, then move the mouse without releasing the left mouse button. When you release the mouse button, Mira leaves palette stretching mode. You can also adjust the palette from controls in the Palette Properties dialog.
To open the Palette Properties dialog, double click on the Colormap or use the View > Palette Properties command.
To reset the current palette to original settings, right double click the mouse on the Colormap.
The range of the Z axis can be adjusted, if desired. You can change the scaling interactively or by entering the minimum and maximum Z values. [examples]
Specify the Z range: Use the View > Z Range > Set Limits command to open the Surface Plot Z Limits dialog
Open the 3-D Plot Context menu and execute the Z Range command.
Autoscale the Z Range: Use the View > Z Range > Autoscale command or the similar command from the 3-D Plot Context menu. This resets the limits to the values when the plot was originally created.
To interactively stretch the Z range, regardless of which way it is specified, move the vertical slider on the right border of the 3-D Plot window.
The 3-D Plot has a number of attributes that can be changed to give you a more meaningful view of the data. Attributes are changes from various windows belonging to the 3-D Plot group. These attributes include the type of plot, the way the 3-D facets are represented, the drawing of projection planes and axes, colors, fonts, viewpoint, and the properties of the illuminating light source. See the following sections for more information on changing these attributes. These commands are available from the 3-D Plot menu bar and the Context Menu:
The 3-D Drawing Attributes dialog allows you to change the drawing attributes and to save them for other plots.
The 3-D Viewpoint tool window adjust the viewing location relative to the data.
The 3-D Window tool window changes the colors and fonts used for drawing the plot.
The 3-D Light Source tool window controls the illumination used for Phong Shading in the Illuminated Surface plot.
See 3-D Pixel Representations to view some of the variations.
The Context menu contains options for changing the way the image data are rendered and for altering the appearance of the window.
Open the 3-D Context Menu the way you open the context menu of any view window: right click on the window interior.
Accelerators in the table below are enabled when a 3-D Plot Window has focus.
3-D Plot Window Accelerators
|
Ctrl+A |
Opens the 3-D Drawing Attributes dialog. |
|
Ctrl+C |
Executes the Copy command, which copies the 3-D plot to the Windows clipboard. The plot is copied as a bitmap. |
|
Ctrl+N |
Executes the New command, which displays the New Document dialog. |
|
Ctrl+O |
Executes the File > Open command, which displays the Open dialog. |
|
Ctrl+R |
Opens the Mira Preferences dialog. Here you can set global preferences for working with images and plots, as well as other aspects of the user interface. |