Y-Axis Attributes
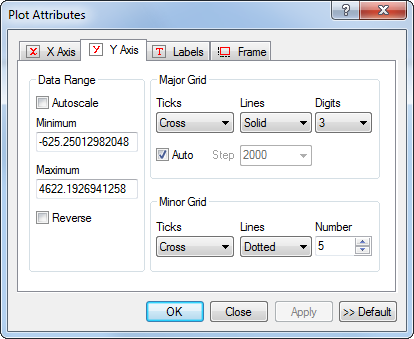
The Y Axis Attributes page allows you to configure the vertical (y) axis of a plot in a Plot Window. Use this page to change the number and style of tick marks and set the axis extent.
To open the Y-Axis Attributes page, open the Plot Attributes dialog and select the Y Axis tab.
|
Tip |
A new plot is created with the y-axis automatically
adjusted to the full range of the data. This is the same as
checking the Auto option in this
dialog. If you uncheck Auto and enter
new limits, you can can return to the autoscaled values by clicking
the |