Plot Attributes
The Plot Attributes dialog allows you to change the appearance of the plot. On the various pages of the dialog you can change the axis scaling, the tick marks, labels, fonts, colors, and more.
Open the Plot Attributes dialog use one of these methods.
The Plot Attributes dialog has 4 pages to organize the different types of attributes.
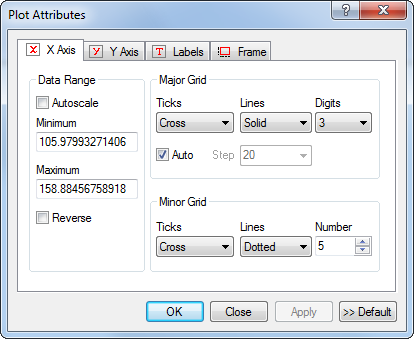
The X-axis Attributes page (shown above) configures the x-axis extent, major and minor ticks.
The Y-axis Attributes page configures the y-axis extent, major and minor ticks.
The Labels Attributes page is used to alter the plot labels and captions.
The Frame Attributes page controls the appearance of the plot frame, including fonts, colors, and lines.