| |
CPlotView:AddPoints
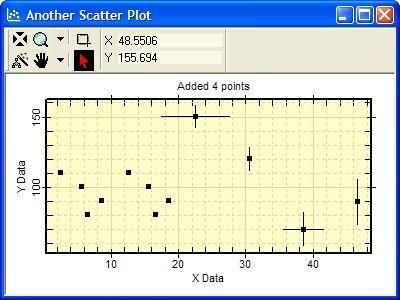
The AddPoints method plots point-data held in the data matrix maintained by the CPlotView class. The data matrix is a CMatrix that can hold one or more series of x,y data as well as y error bars and x,y error bars. The illustration below shows all three types of matrix data.
bSuccess = CPlotView:AddPoints()
![]() On success, the
method returns true.
On success, the
method returns true.
![]() On failure
false is
returned.
On failure
false is
returned.
|
|
Scatter plot showing 8 (x,y) points plus 4 additional points with error bars added using the present method. All 12 points could have been plotted at one time. |
This method adds data points to the current series. All the points in the class data matrix are added. To set the current plot series, use SetIndex.
Assume that a CPlotView V exists and is attached to the window shown above. The script fragment below added the 4 points with error bars to the plot window:
|
V:SetCurrentIndex(2) |
-- select the plot series |
|
V:Empty() |
-- clear existing data from the array |
|
V:Add( 38.52, 70.5, 3, 12) |
-- x, y, xerrorbar, yerrorbar |
|
V:Add( 22.52, 150.5, 5, 8) |
-- x, y, xerrorbar, yerrorbar |
|
V:Add( 30.5, 120.22, 8) |
-- x, y, yerrorbar |
|
V:Add( 46.5, 90, 16.5) |
-- x, y, yerrorbar |
|
V:AddPoints() |
-- add the data |