| |
CPlotView:PlotPoints
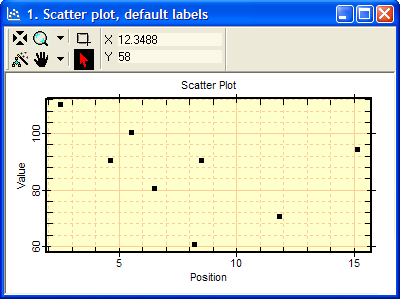
The PlotPoints method draws points from the class data matrix in a new plot window. The data array supports points as well as y error bars and x,y error bars. The illustration below shows only (x,y) pairs without errorbars.
bSuccess = CPlotView:PlotPoints( sX, sY, sTitle, sCaption )
All 4 parameters are optional:
![]() sX is the x axis label. If omitted or nil, a default is used.
sX is the x axis label. If omitted or nil, a default is used.
![]() sY is the y axis label. If omitted or nil, a default is used.
sY is the y axis label. If omitted or nil, a default is used.
![]() sTitle is the window title. If omitted or nil, a default is used.
sTitle is the window title. If omitted or nil, a default is used.
![]() sCaption is the plot caption. If omitted or
nil, a default is used.
sCaption is the plot caption. If omitted or
nil, a default is used.
![]() On success, the
method creates a new plot window and returns true.
On success, the
method creates a new plot window and returns true.
![]() On failure
false is
returned.
On failure
false is
returned.
|
|
Scatter plot showing 8 (x,y) points. All points make a single plot series using the same symbol attributes. |
To plot the same data as connected lines rather than as discrete symbols, use the PlotDataLine method. To plot a range of rows or a single row, use the PlotDataRange method.
This method plots all points in the class data matrix as a single series in a plot window. Data points are drawn as symbols as shown above.
The script below created the plot window shown above. Although this example shows simple (x,y) points, you could have plotted y errorbars or x,y errorbars by including their values as extra arguments in the Add method.
|
V = CPlotView:new() |
-- create a new CPlotView |
|
V:Add( 5.52, 100.5) |
-- add point 1: x=5.62, y=100.5 |
|
V:Add( 6.52, 80.5) |
-- add other points |
|
V:Add( 8.52, 90.5) |
|
|
V:Add( 2.52, 110.5) |
|
|
V:Add( 15.12, 94.5) |
|
|
V:Add( 8.22, 60.5) |
|
|
V:Add( 11.82, 70.5) |
|
|
V:Add( 4.62, 90.5) |
|
|
V:PlotPoints() |
-- make the plot |