| |
CPlotView:PlotMatrixLine
The PlotMatrixLine method makes a connected line plot from all of the rows of a CMatrix. Each row is plotted as a separate plot series.
bSuccess = CPlotView:PlotMatrixLine( CMatrix, sX, sY, sTitle, sCaption )
![]() CMatrix is a matrix holding the data to plot. All
lines (rows) are plotted.
CMatrix is a matrix holding the data to plot. All
lines (rows) are plotted.
![]() sX is the optional x axis label. If omitted or
nil, a default is
used.
sX is the optional x axis label. If omitted or
nil, a default is
used.
![]() sY is the optional y axis label. If omitted or
nil, a default is
used.
sY is the optional y axis label. If omitted or
nil, a default is
used.
![]() sTitle is the optional window title. If omitted or
nil, a default is
used.
sTitle is the optional window title. If omitted or
nil, a default is
used.
![]() sCaption is the optional plot caption. If omitted
or nil, a default is
used.
sCaption is the optional plot caption. If omitted
or nil, a default is
used.
![]() On success, the
method creates a plot window and returns true.
On success, the
method creates a plot window and returns true.
![]() On failure
false is
returned.
On failure
false is
returned.
|
|
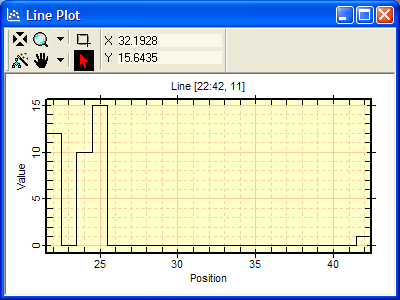
Line plot using default labels for x axis, y axis, title, and caption. The CMatrix contains one line, which is row 11. The caption above the plot box shows that columns 22 through 42 were plotted from row 11. |
This method plots all of the rows of a sparse matrix using the CMatrix class. The sparse matrix is filled with members that consist of a row and column index and a value. To plot a range of rows, or only a single row, use the PlotMatrixRangeLine method. The fact that the CMatrix is sparse means that every cell does not have to be populated. In other words, indices do not need to exist between 1 and the minimum column or between 1 and the minimum row. Similarly, the matrix may have "holes" between minimum column and maximum column. For example, the picture above shows a plot made from 4 points existing in a 1-row matrix (see the data in the example, below).
The plot window above shows 4 data points having y=11 in the range x=22 to x=42. The data and plot were generated by the following script. Note: we equate "x" to column index and "y" to row index.
|
A = CMatrix:new() |
-- create a new CMatrix |
|
A:Set( 11, 24, 10) |
-- add a point at y=11, x=24, value= 10 |
|
A:Set( 11, 22, 12) |
-- add a point at y=11, x=22 |
|
A:Set( 11, 42, 1) |
-- add a point at y=11, x=42 |
|
A:Set( 11, 25, 15) |
-- add a point at y=11, x=25 |
|
P = CPlotView:new() |
-- create a new CPlotView |
|
P:PlotMatrixLine(A) |
-- create the line plot |