-
Create the Bit Histogram plot using the Measure > Diagnostics > Bit Histogram command. or use the drop-button menu beside the Histogram button on the main toolbar (shown at left).
Bit Histogram Plot
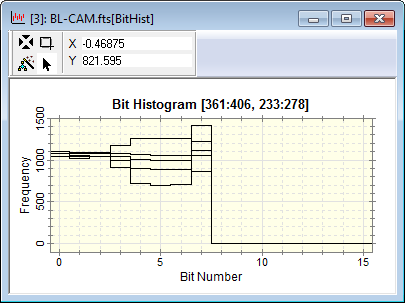
The Bit Histogram command plots a histogram of the frequency of bit values in the digital image, as sampled inside the image cursor. The histogram frequency measures the occurrence of each power of 2 in the values of the pixels, as measured in digital counts (e.g., Analog to Digital Units, ADU, or Digital Number, DN). This type of plot is helpful for assessing whether the camera's A/D Converter is performing correctly and whether it is limited by random noise or favors certain bits.
NOTE: The bit histogram plot often looks best when the Default line is Stepped Line option is checked in the General Properties dialog (Ctrl+R).
|
|
|
The example below shows two examples of a bit histogram: a single image and all 5 images in an image set, shown with the Plot Window in Overlay mode.
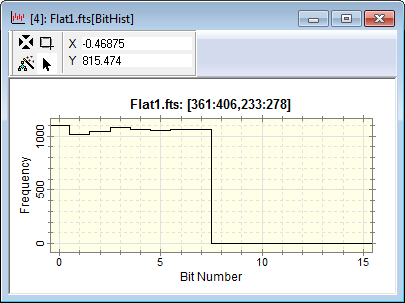
In a digital image, pixel values are represented as binary numbers which are the sums of powers of 2. For example, a pixel value of 21 is represented as follows: 21 = 16 + 4 + 1 = (1*24) +(1*22) + (1*20). This number would be represented in a bit histogram as 1 added to the frequency for bits 4, 2, and 0. A pixel value of 16384, or 1*214, would add 1 to the frequency for bit 14. In the ideal case, in which the noise is totally random, the lowest bit numbers within the noise should be equally represented. Considering the example for 16,384, it is clear that only the high pixel values contribute to the high bits in the bit histogram.
As an example, consider the plots above. The histograms of 5 different images are are similar below bit 3 but they diverge for bit 3 and above. There is almost no signal above bit 7 which would correspond to signal in the range of 128 to 255 (the gap between bit 7 and bit 8). These images have an offset (background level) of 128 to 131, and this is shown by the bit histograms. The most interesting bits are the lowest order bits, those with bit numbers 0, 1, 2, etc., since they are represent variations within the camera noise. The lowest order bits help to answer the question of whether the A/D converter is limited by true random noise or whether it is biased toward certain bits. A single high or low bit, markedly different from its neighbors, would indicate such a bias, but no such bias is evident here.
Mira Pro x64 User's Guide, Copyright Ⓒ 2023 Mirametrics, Inc. All
Rights Reserved.