Plot Windows
Plot Windows display 1-D data in the form of a 2-D graph, or "plot" and provide several tools for interactively working with the data. The different aspects of plotting data are described in Plotting Images and Data.
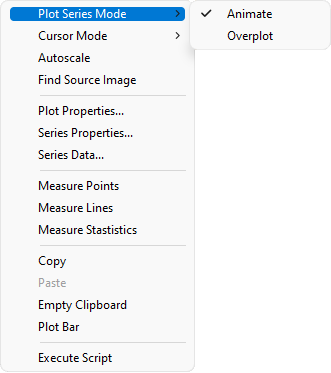
The pictures below show a typical Plot Window with the Plot Bar at the top border and the Plot Animation Bar at bottom border. The Plot Bar can be shown or hidden using theToolbar command in the Plot menu or the option of the Image Plot Properties dialog. In the second picture, the window is changed to Overplot mode using the command in the Plot Context Menu. You can control whether Mira prompts you to confirm closing a Plot Window using the check list item in the General Properties dialog.
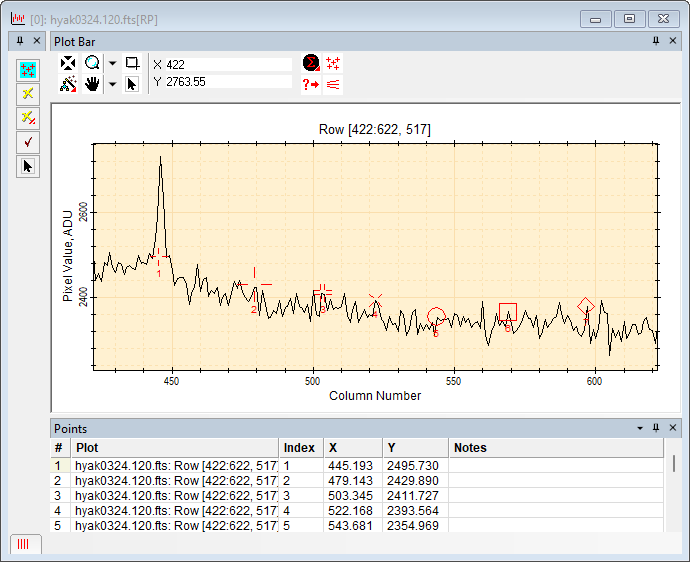
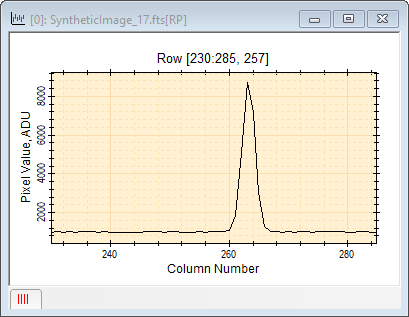
Below is a typical Plot Window showing an image row plotted along with the Plot Bar at top, Plot Points Toolbar at the left, and the Points Measurements Pane at bottom. At the bottom left corner is the Plot Animation Bar reduced to a tab. An assortment of point markers is shown along the plot.
Since many plots are created from displayed images, Plot Windows can also link to the original source Image Window, Image, and pixel coordinates of the plot data in the image. See Go to Source Image.
The Mira Pro Script language provides an immense collection of script functions and classes to work with Plot Windows and the Plot Series they contain. In addition, scripts can be executed (launched) directly from the Plot Window to work with its plot data. The Execute Script menu command opens for selecting a script, then executes the script. When the script is executed, it is automatically sent a CPlotView object and CPlot object attached to the window and the current plot series. Scripts can also be launched from grid measurement panes attached to the Plot Window. The installed folder <Documents>/Mira Pro x64 Data/Scripts/Samples contains a sample script to be called from the Plot Window, named "Execute from a Plot Window test.lua". See the Mira Pro x64 Script User's Guide for details.
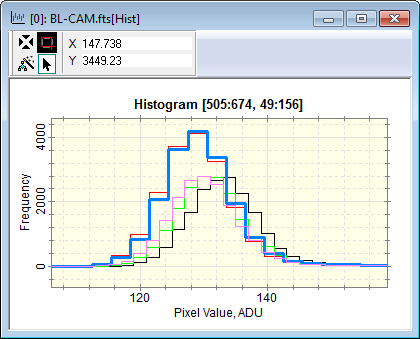
A Plot Window can contain more than 1 series of data (that is, more than 1 plot), such as obtained from multiple images, multiple rows, or other sources. You can also create multiple plot series using copy + paste to add data from other Plot Windows. In such cases, you can choose from 2 modes to view the multiple series:
Animate Mode: One plot series is shown at one time. You can switch between series using the Plot Animation Bar.
Overplot Mode: All plot series are displayed at once on the same set of axes.
These alternatives are shown in the pictures below. To create these plots, a column plot was made for a single slice through an image set containing 5 images. This makes 5 plot series—one from each image.
This window has 5 plot series. In this mode, only 1 series is displayed at a time.
This picture shows all five plot series at the same time. The color assigned to each series is configured in the Plot Properties dialog. The Plot Series Properties also can be altered afterward using the Plot Properties dialog.
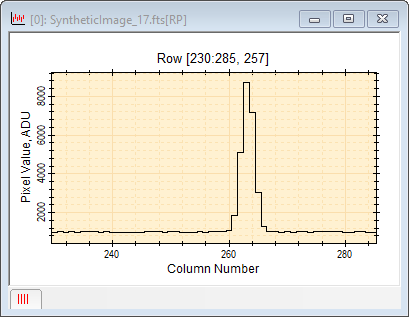
There are many ways to create Row Profile Plots and Column Profile Plots like those shown above.
The Plot Window provides a number of toolbars for working with the plotted data.
The top border of the Plot Window has a Plot Bar which acts as a control center for working with the displayed data. This is similar in function to the Image Bar of the Image Window. The Plot Bar has buttons for changing the appearance of the data and a coordinate readout which is continuously updated when the mouse pointer is over the Plot Window.
If multiple plot series are graphed but displayed individually, the bottom border shows the Plot Animation Bar. The Plot Animation Bar lets you step through or animate through Plot Series in the same way the Image Animation Bar interacts with an Image Set.
Plot Point Measurements: Point values may be marked on the plot to collect the (x,y) coordinates of a location. See the Plot Point Measurements topic.
Plot Line Measurements: Lines may be marked on the plot to collect the (x,y) endpoint coordinates and distance between them. See the Plot Line Measurements topic.
Use the Measure > Statistics and Measure > Statistics Properties commands to compute statistics on the plot series data. These command are found in the Plot Window's pull-down menu and the Plot Bar. See the Statistics Measurements and Statistics Properties. A selected statistic can also be drawn in the Plot Window using the Mark Statistic command.
All of the profile plots show image intensity versus position or distance. For these types, Mira also provides the following coordinate system options:
The Pixel Coordinates option measures pixel position in column or row [number].
The World Coordinates option measures position in world units such as cm, microns, or other units. If the calibration uses Celestial Coordinates (RA, Dec), then the plot uses [arcseconds] in a relative sense.
To change the default setting, see Plotting in World Coordinates.
Intensity is displayed on the vertical axis of a profile plot and the horizontal axis of a histogram plot. The Intensity Axis label includes the units of intensity if the image header contains such information.
Line graphs drawn in Plot Windows may default to either a stepped line or jagged line. The choice is made by setting the Default Line is Stepped Line option in the General Properties dialog (Ctrl+R). Below are shown the same plot made with the Default Line is Stepped Line option checked (left) and unchecked (right).
The properties of the plot can be set before the plot is created and changed after the plot is created.
The Image Plot Properties control how the plot is created from the image. This includes, for example, whether Pixel or World Coordinates are used and what colors are used for multiple plot series.
The Plot Properties control the way the finished plot is displayed. You can change the axis scaling, colors, fonts, labels, tick marks, and other properties using the pages of the Plot Properties dialog.
The Plot Series Properties define the way the data in the plot series are displayed. This includes the size, color, and style of markers and lines.
Right clicking inside a Plot Window opens a Context Menu containing several commands. These commands are duplicated in the pull-down menus but are collected here for quick access. The picture below shows the Plot Series Mode submenu opened and Animate mode selected for use by the Plot Animation Bar.
Accelerators in the table below execute commands when a Plot Window has focus.
Plot Accelerators
|
Ctrl+A |
Opens the Plot Properties dialog for setting the Properties for the Plot window and the plotted data. |
|
Ctrl+Shift+A |
Open the Plot Series Properties dialog. |
|
Ctrl+C |
Executes the Copy command, which copies the window's plot series to the Windows clipboard. |
|
Ctrl+N |
Executes the New command, which displays the New Document dialog. |
|
Ctrl+O |
Executes the File > Open command, which displays the Open dialog. |
|
Ctrl+P |
Prints the Plot Window. |
|
Ctrl+R |
Opens the General Properties dialog. |
|
Ctrl+V |
Executes the Paste command to paste plot series from the clipboard into the current Plot Window. |
To view the numeric plot data, user the Plot Series Data command. This opens the numeric data for all series into a grid window. The window has buttons to save, print, and copy the data to the Windows Clipboard. Use the Save as Text command to save the data to a file. This command is available from theFile menu when a Plot Window is the top-most view.
The intensity profile of an image can be plotted using either the Column or Row Profile command or the Line Profile tool. There are some unique capabilities offered by each method.
Comparison of Profile Plot Types
|
Property |
Column or Row Profile |
Line Profile |
Radial Profile |
|
Uses the Image Cursor to sample pixels |
|
|
|
|
Uses the mouse pointer to sample pixels |
|
|
|
|
Uses Pixel coordinates |
|
|
|
|
Uses World coordinates |
|
|
|
|
Append series from parallel pixel samples |
|
|
|
|
Append series using Copy / Paste |
|
|
|
|
Profile must be parallel to rows or columns |
|
|
|
|
|
|||
All of the profile plots show image intensity versus position or distance. For these types, Mira also provides the following coordinate system options:
Coordinate (Horizontal) Axis:
Use Pixel Coordinates to measure pixel position in column or row [number].
Use World Coordinates to measure position in world units like cm, microns, or angular units of arcseconds.
To change the default setting, see Plotting in World Coordinates.
Intensity (Vertical) Axis:
Intensity is displayed on the vertical axis of a profile plot and the horizontal axis of a histogram plot. The Intensity Axis label includes the units of intensity if the image header contains such information.
A Plot Series is a series of points that create one plot. Multiple plot series can be considered to make a Plot Set, akin to the concept of an Image Set for Image Windows. As an example, consider a Column Profile plot which plots image intensity versus position along a single column with varying row number. If 5 such plots ("plot series") are created and shown in the same plot window, then the Plot Window contains a plot set of 5 plot series, with each series member being an individual plot.
Why use the term "Plot Series" rather than just "Plot"? The reason for this extends from the fact that some Mira functions show a connected line plot for one data set in multiple segments. Each segment can be considered a plot of those data, but the multiple plots comprise only one plot series.
When multiple plot series are displayed in the same Plot Window, they may be visualized in the following ways:
In Animate mode, only the active plot of the plot series is displayed, the same as if viewing a window containing only 1 plot. The other plots in the series may be viewed by stepping or animating through the set using the Plot Animation Bar much the same way the Image Animation Bar steps through anImage Set.
In Overplot mode, the entire plot set containing all plot series is displayed simultaneously on the same set of axes.
When the plot set contains more than one plot series, one or all plots may be viewed according to the plotting mode. See Changing the Plot Series Mode.
The data for all plots in the plot series may be displayed as a grid in the Series Data window which also provides some analysis options. See Plot Series Data.
Adjacent lines (columns or rows) may be combined to form a single line to be plotted. The method of combining is controlled by the Plot Averaging Mode command. The name of the plot appears in the command menu from which the plot is created (see Plotting an Averaged Line).
Image Plot Properties control how the plot is created from the image. This includes, for example, whether Pixel or World Coordinates are used and what colors are used for multiple plot series. These settings are changed using the Image Plot Properties dialogs
Plot Properties control the way the finished plot is displayed. You can change the axis scaling, colors, fonts, labels, tick marks, and other properties using the pages of the Plot Properties dialog.
The Plot Window title lists the image name from which the plot was created and gives an abbreviation that describes the type of plot. The plot type is abbreviated and appended to the window caption in square brackets. For example, a Row Plot is signified by [RP] appended to the Plot window caption. These suffixes appear in the window list of the Window menu and in the Multi-tab Interface along the bottom border of Mira's main window.
|
Note |
After using the Windows Copy + Paste protocol to add series to a plot window, the window caption may not accurately reflect the content of the window. You can change the caption using the Plot Properties command. |
The Plot Caption is the text above the plot box but below the top window border. The Plot Caption tells you information about what was plotted. In particular, it may list the beginning and ending coordinates in (x,y) form for a Line Profile Plot or it may list the column and row range for a Column Profile or Row Profile plot. Below are some examples that show how to read the column,row range in the plot caption:
Example Regions Listed in the Plot Caption
|
[125:140, 180:182] |
Columns 125 through 140, inclusive and rows 180 through 182, inclusive. This describes 16 columns and 3 rows. |
|
[125:140, 180] |
Columns 125 through 140, inclusive and row 180. This describes 16 columns and 1 row. |
You can change the plot title, caption, and axis labels using the Labels page of the Plot Properties dialog.
Mira Pro x64 User's Guide, Copyright Ⓒ 2023 Mirametrics, Inc. All
Rights Reserved.