Chart Axis Limits
The Chart Axis Limits dialog is used to specify the exact limits of the plot inside the Chart Window. Only numeric limits larger and smaller than the listed Minimum and Maximum values can be set, and values inside these extremes will create a scrollbar along the corresponding chart axis. Initially, with no scrollbars, the numbers in the text boxes correspond to the Minimum and Maximum values.
Open the Chart Axis Limits dialog using the option in the Chart Command Menu of the Chart Window.
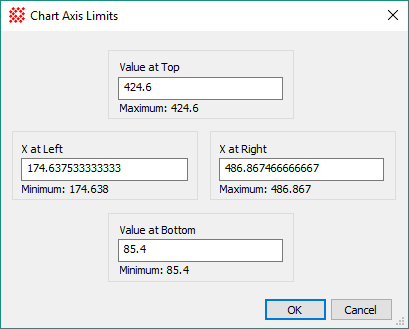
Captions above the text boxes combine the name of the chart axis with a suffix like "at Left" or "at Bottom". For example, if the vertical chart axis is named "Value", then the caption "Value at Bottom" refers to the numeric value of "Value" used at the bottom of the chart. The Minimum and Maximum fields indicate the most extreme values that can be used.
Mira Pro x64 User's Guide, Copyright Ⓒ 2023 Mirametrics, Inc. All
Rights Reserved.