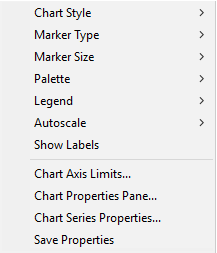
Chart Command Menu
The Chart Command Menu provides commands for changing the data presentation and setting window properties. These commands generally change the properties for the entire chart. If the chart contains more than one data series, changes can be targeted to specific series using the Chart Series Properties... command.
Open the Chart Command Menu by right-clicking inside the Chart Window.
|
The Create Chart Command Menu |
|
|
Graph Style |
Changes the type of graph that is displayed: Markers: Creates a scatter plot using markers. Markers with Lines: Creates a scatter plot using markers connected by lines. Markers with Splines: Creates a scatter plot using markers connected by splines. Bars: Creates a bar plot. Area: Creates an area plot. Area with Splines: Creates an area plot with values connected by splines. |
|
Marker Type |
Selects the marker type. |
|
Marker Size |
Selects the marker size. |
|
Palette |
Selects the color scheme for markers, lines, and areas. |
|
Legend |
Selects legend properties using the Chart Legend Properties dialog. |
|
Show Labels |
Enables or disables labels showing the Y-Value for each point. |
|
Chart Axis Limits... |
Opens the Chart Axis Limits dialog for specifying one or more of the axis limits for the plot inside the chart window. |
|
Chart Properties Pane... |
Opens the Chart Properties Pane for specifying the general properties of the chart. |
|
Chart Series Properties... |
Opens the Chart Series Properties dialog for specifying the properties of individual data series plotted in the chart. |
|
Save Properties |
Saves the current properties for future charts. |
Mira Pro x64 User's Guide, Copyright Ⓒ 2023 Mirametrics, Inc. All
Rights Reserved.