Example of Changing Plot Series Properties
The pictures below show the effect of changing the properties of a plot using the Plot Series Properties command. The series properties can be set before the plot is created by using the Plot Properties page (Ctrl+R).
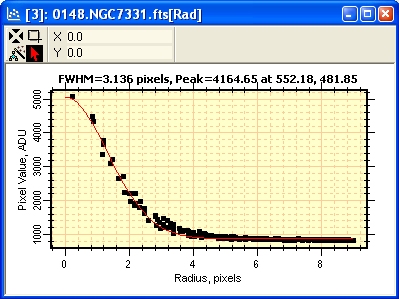
Radial profile plot made using the default series properties set on the Plot Properties page of the General Properties.
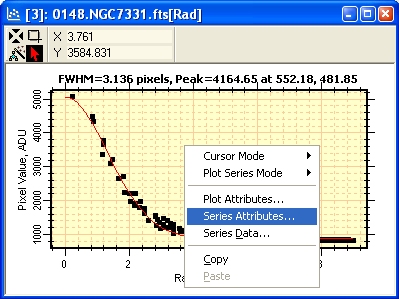
Right click on the plot window to open the Plot Context menu. Then select the Series Properties item. You may also shortcut the menu command simply by using Ctrl+Shift+A on the Plot window.
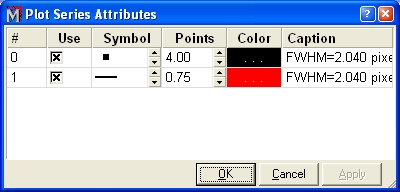
The Plot Series Properties dialog opens showing the current settings for all series of the Plot Window.
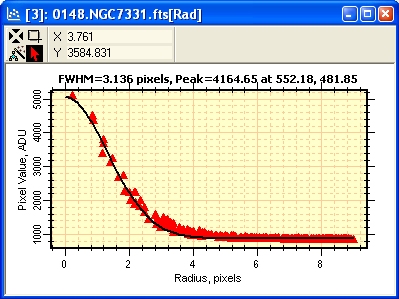
The up/down arrows were used to increase the line thickness from 0.75 to 1.5 points and the symbol size from 4.0 to 6.0 points. The symbol was changed from square to triangle and the colors of both series were also altered. To save the changes to the parent plot window, we would click [OK] or [Apply].
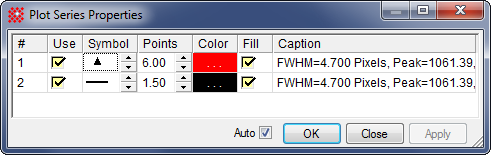
The result of making the changes described above.
Mira Pro x64 User's Guide, Copyright Ⓒ 2023 Mirametrics, Inc. All
Rights Reserved.