![]() Pixel Series
Plot
Pixel Series
Plot
A Pixel Series Plot shows the variation of pixels at the same locations in the members of an image set. This command works with the Image Cursor and requires an Image Set.
Move the Image Cursor to the pixel location of interest. The cursor can be moved using the keyboard arrow keys or by using Cursor Mode for the Image Window.
Select the shape of the Image Cursor based upon what pixels you want to plot.
A crosshair cursor plots only the pixel location at the center of the crosshair.
A rectangle cursor causes all points inside the rectangle to be plotted. Be careful about using this option for large rectangles!
Use the Plot > Pixel Series command or
click the ![]() button.
button.
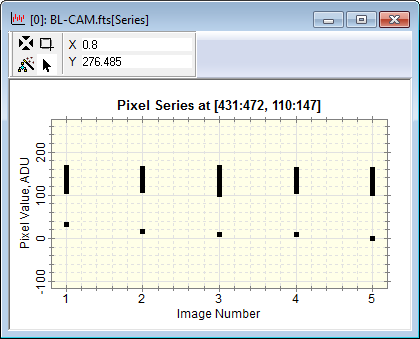
The window below shows a Pixel Series for 2,601 pixels in 4 images. The Image Cursor was a 51x51 pixel rectangle, thus outlining 2,601 pixels in each image.
Mira Pro x64 User's Guide, Copyright Ⓒ 2023 Mirametrics, Inc. All
Rights Reserved.