Comparison of non-Class Plotting Functions
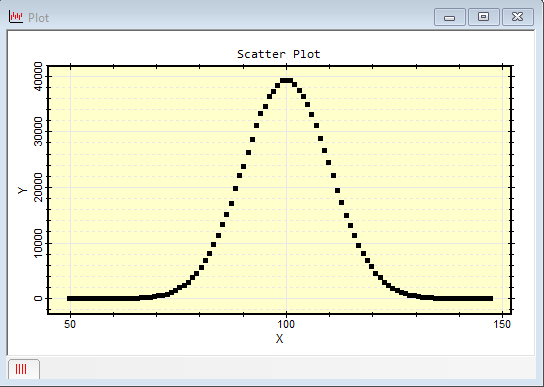
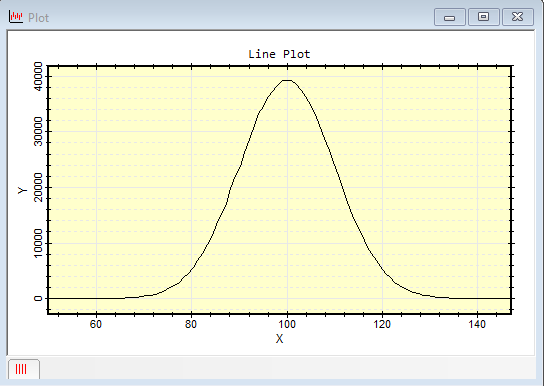
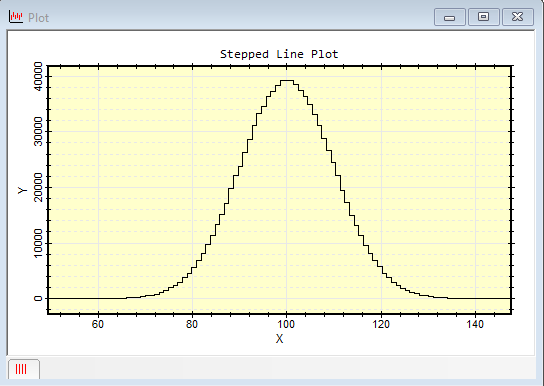
The non-class plotting functions expedite plotting arrays (indexed tables) outside of the CPlotView class when you do not need to make specialized or complex changes to the plot appearance. These 4 functions include scatter, connect, line, and stepline. The pictures below were made using the same arrays of 20 random x and y values. In this example, the arrays were sorted using table.sort() before plotting so that the random values were increasing in both x and y. The scatter function also includes y error bars.
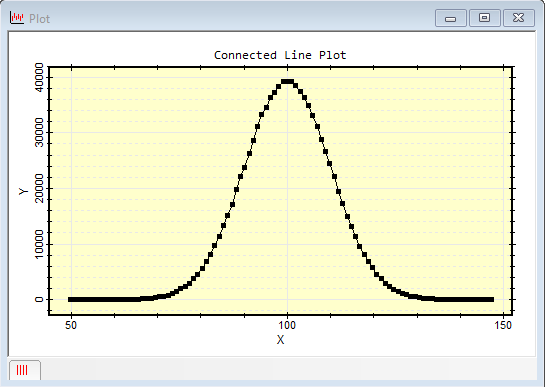
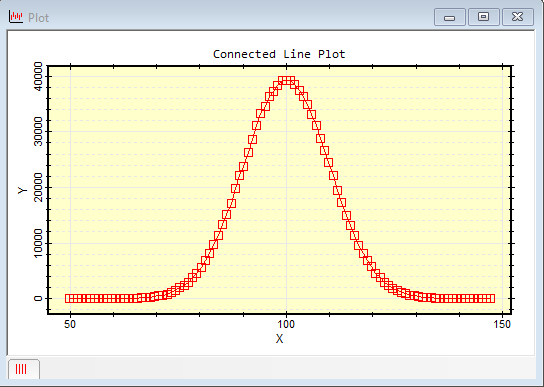
The plot symbols and attributes are set initially using the "View > Default Properties > Image Plots" menu command. They can also be changed after plotting using the "View > Series Attributes" command for the Plot Window. For example, the connected line plot above was altered using the Series Attributes command to use red color, and unfilled markers of 6-point size:
To get hybrid plots that merge two or more types, you can run one plotting function and then another on the same data. Then use the Ctrl+C and Ctrl+V (edit > copy and edit > paste) commands to copy and paste one or more plots (one at a time) onto one chosen as the "master" plot. The individual plots are shown together by switching to Overlay mode.
CPlotView Class, line, connect, scatter, stepline, Plotting Functions
Mira Pro x64 Script User's Guide, Copyright Ⓒ 2023 Mirametrics,
Inc. All Rights Reserved.