scatter (replaces ScatterPlot)
The scatter function creates a scatter plot using markers for data points. This is an efficient non-class equivalent to the CPlotView:Scatter method. The x and y points at the same array index are presumed to correspond to the same point. This function does not plot x or y error bars; to include error bars, use scattererr. The data for x and y are in a lua array (1-dimensional indexed table). This function creates a new plot window and returns a CPlotView object and a CPlot object for the plot and the plot series it creates. These objects can be used to enhance or add to the plot or extract plot data for further analysis. There are four similar versions of this command as shown in the Comparison of non-class plotting functions.
CPlotView, CPlot = scatter( x, y )
CPlotView, CPlot = scatter( x, y, sLabelX )
CPlotView, CPlot = scatter( x, y, sLabelX, sLabelY )
CPlotView, CPlot = scatter( x, y, sLabelX, sLabelY, sCaption )
CPlotView, CPlot = scatter( x, y, sLabelX, sLabelY, sCaption, sWindowTitle )
![]() x is a 1-dimensional array containing the x
values.
x is a 1-dimensional array containing the x
values.
![]() y is a 1-dimensional array containing the x
values.
y is a 1-dimensional array containing the x
values.
![]() sLabelX is an optional label for the x
axis.
sLabelX is an optional label for the x
axis.
![]() sLabelY is an
optional label for the y axis.
sLabelY is an
optional label for the y axis.
![]() sCaption is an optional plot caption.
sCaption is an optional plot caption.
![]() sWindowTitle is an optional plot window
title.
sWindowTitle is an optional plot window
title.
![]() Parameters that are nil or missing to the right adopt default
values.
Parameters that are nil or missing to the right adopt default
values.
Return values:
![]() CPlotView
is a new CPlotView object attached to the plot window. It is
nil on failure.
CPlotView
is a new CPlotView object attached to the plot window. It is
nil on failure.
![]() CPlot is a
new CPlot
object attached to the current plot series. It is nil on failure.
CPlot is a
new CPlot
object attached to the current plot series. It is nil on failure.
This function creates a quick plot using just one line of code. The returned values of V and P provide access to the plot window and plotted data. You can also change the plot properties including the marker attributes, labels, scaling, and others using commands such as Series Attributes and Plot Attributes.
Only the first 2 arguments, the (x,y) data, are required. If you want to use the other arguments, you must include a placeholder to fill any holes between the arguments. For example, to include y error bars but not x error bars, use nil in place of the xe parameter.
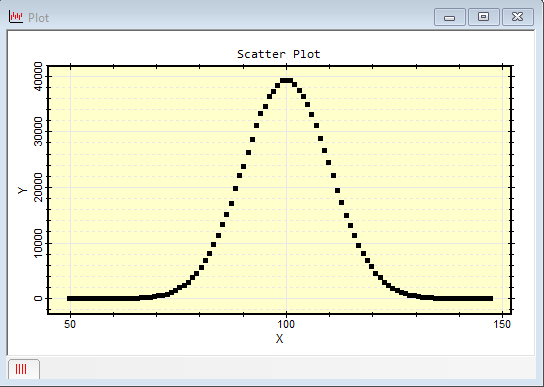
The script below creates some data from the random number generator and creates a scatter plot with default plot labels. Since none of the optional parameters is used, only the x and y arrays need to be specified.
|
|
-- 10 values between 10 and 20 |
|
|
-- 10 values between 20 and 40 |
|
|
-- create the scatter plot |
scattererr, plot, connect, line, stepline, CPlotView class, Plotting Functions, Comparison of non-Class Plotting Functions
Mira Pro x64 Script User's Guide, Copyright Ⓒ 2023 Mirametrics,
Inc. All Rights Reserved.