CPlotView:AddPoints
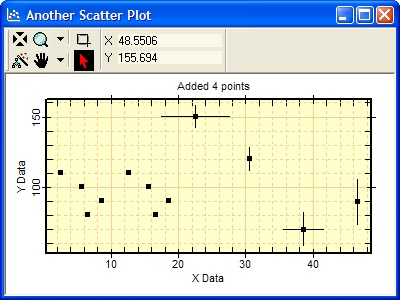
The AddPoints method plots data held in the class data matrix. The data matrix is a CMatrix that can hold one or more series of x,y data as well as y error bars and x,y error bars. The illustration below shows all three types of matrix data.
CPlot, nSeries = CPlotView:AddPoints()
![]() On success,
CPlot is a new CPlot object
attached to the plot series at index nSeries. On failure, nil,
0 is returned.
On success,
CPlot is a new CPlot object
attached to the plot series at index nSeries. On failure, nil,
0 is returned.
|
|
Scatter plot showing 8 (x,y) points plus 4 additional points with error bars added using the present method. All 12 points could have been plotted at one time. |
This method adds data points to the current series. All the points in the class data matrix are added. To set the current plot series, use SetIndex.
Assume that a CPlotView V exists and is attached to the window shown above. The script below added the 4 points with error bars to the plot window:
|
|
-- select the plot series |
|
|
-- clear existing data from the data matrix |
|
|
-- x, y, xerrorbar, yerrorbar |
|
|
-- x, y, xerrorbar, yerrorbar |
|
|
-- x, y, yerrorbar |
|
|
-- x, y, yerrorbar |
|
|
-- add the data matrix |
CPlotView class, PlotPoints, AddSeries
Mira Pro x64 Script User's Guide, Copyright Ⓒ 2023 Mirametrics,
Inc. All Rights Reserved.