CPlotView:PlotPoints
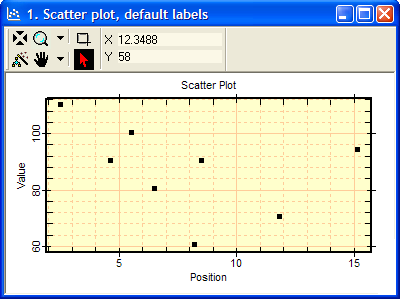
The PlotPoints method draws the class data in a new plot window. This method can plot markers, lines, and errorbars for both axes. The illustration below shows only (x,y) pairs without errorbars.
CPlot = CPlotView:PlotPoints()
CPlot = CPlotView:PlotPoints( sX )
CPlot = CPlotView:PlotPoints( sX, sY )
CPlot = CPlotView:PlotPoints( sX, sY, sTitle )
CPlot = CPlotView:PlotPoints( sX, sY, sTitle, sCaption )
![]() sX is the
optional x axis label. If nil, a default is used.
sX is the
optional x axis label. If nil, a default is used.
![]() sY is the
optional y axis label. If nil, a default is used.
sY is the
optional y axis label. If nil, a default is used.
![]() sTitle is
the optional window title. If nil, a default is used.
sTitle is
the optional window title. If nil, a default is used.
![]() sCaption is
the optional plot caption. If nil, a default is used.
sCaption is
the optional plot caption. If nil, a default is used.
Return value:
![]() CPlot is a new CPlot object
attached to the current plot series. It is nil on failure.
CPlot is a new CPlot object
attached to the current plot series. It is nil on failure.
The first plot below shows a simple scatter plot without error bars. This plot was generated using the first sample script in the Examples, below.
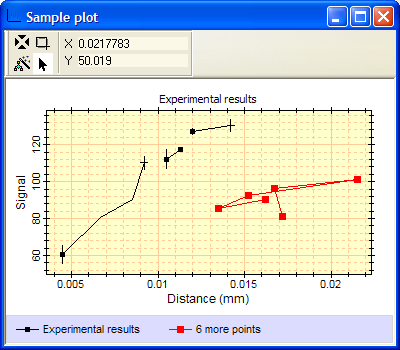
The plot below was generated using the second script in the Examples, below. To plot the same data as connected lines rather than as discrete symbols, use the PlotDataLine method. To plot a range of rows or a single row, use the PlotDataRange method.
The script below created the plot window shown above. Although this example shows simple (x,y) points, y errorbars or x,y errorbars could have been plotted by adding them their extra arguments in the Add method.
|
|
-- create a new CPlotView |
|
|
-- add point 1: x=5.62, y=100.5 |
|
|
-- add other points |
|
|
|
|
|
|
|
|
|
|
|
|
|
|
|
|
|
|
|
-- make the plot |
|
|
|
|
The next example is far more sophisticated but only a little more complicated. This example uses all 5 arguments for the Add method, which includes the draw mode for each point (e.g., move to, line to, marker, etc.). The script adds points into 2 data series and displays them simultaneously in "over plot" mode. Error bars are included in the first series. This script generated the plot shown above.
|
|
|
|
|
-- add marker (with error bars) |
|
|
-- line to point |
|
|
-- line to point |
|
|
-- line to [pomt with error bars |
|
|
-- add marker with error bars |
|
|
-- line to marker |
|
|
-- add marker with error bar |
|
|
-- line to point with error bars |
|
|
|
|
-- Display the points in a new plot window |
|
|
|
|
|
|
|
|
-- define another group of points (not ordered by increasing x value) |
|
|
|
-- emove data points already defined |
|
|
-- add all points as "LineToMarker" |
|
|
|
|
|
|
|
|
|
|
|
|
|
|
|
|
|
-- add these 6 points as a new series |
|
|
|
|
|
-- add legend at bottom |
|
|
-- change to "overplot" mode. |
CPlotView class, PlotMatrix, PlotDataLine, AddPoints, PlotLine
Mira Pro x64 Script User's Guide, Copyright Ⓒ 2023 Mirametrics,
Inc. All Rights Reserved.