CPlotView:PlotMatrixRangeLine
The PlotMatrixRangeLine method plots a range of lines of data stored in the rows of a CMatrix. This method uses an external matrix, not the class data matrix. Each line creates a different plot series.
CPlot = CPlotView:PlotMatrixRangeLine( CMatrix, y1, y2 )
CPlot = CPlotView:PlotMatrixRangeLine( CMatrix, y1, y2, sX )
CPlot = CPlotView:PlotMatrixRangeLine( CMatrix, y1, y2, sX, sY )
CPlot = CPlotView:PlotMatrixRangeLine( CMatrix, y1, y2, sX, sY, sTitle )
CPlot = CPlotView:PlotMatrixRangeLine( CMatrix, y1, y2, sX, sY, sTitle, sCaption )
![]() CMatrix is
a matrix holding the data to plot.
CMatrix is
a matrix holding the data to plot.
![]() y1 is the
minimum row number to plot, beginning at row 1.
y1 is the
minimum row number to plot, beginning at row 1.
![]() y2 is the
maximum row number to plot, beginning at row 1.
y2 is the
maximum row number to plot, beginning at row 1.
![]() sX is the
optional x axis label. If nil, a default is used.
sX is the
optional x axis label. If nil, a default is used.
![]() sY is the
optional y axis label. If nil, a default is used.
sY is the
optional y axis label. If nil, a default is used.
![]() sTitle is
the optional window title. If nil, a default is used.
sTitle is
the optional window title. If nil, a default is used.
![]() sCaption is
the optional plot caption. If nil, a default is used.
sCaption is
the optional plot caption. If nil, a default is used.
Return value:
![]() CPlot is a new CPlot object
attached to the current plot series. It is nil on failure.
CPlot is a new CPlot object
attached to the current plot series. It is nil on failure.
|
|
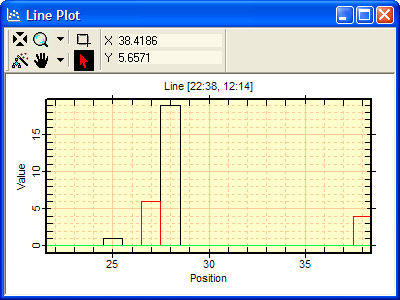
Line Plot window using default x label, y label, title, and caption. The caption above the plot box shows that data in columns 22 42 and rows 12 through 14 were plotted. The 3 rows were plotted in 3 series using different colors (black, red, green). There were no points in row 14. |
This method make a connected line plot from a range of rows in a CMatrix. Alternatively, you can make the same type of plot, but with symbols instead of connect lines, using the PlotMatrixRange method. In comparison, the PlotMatrixLine and PlotMatrix methods plot all rows of the matrix, rather than a range of rows.
The plotted data come from a sparse CMatrix. The matrix contains values at (column,row) indices. The matrix rows are not required to have the same beginning and ending columns. Every row does not have to exist in the plotted range, nor does every column need a value. Holes are automatically set to 0. For example, the picture above shows a plot made from 4 points existing in the first row of a small matrix (see the example, below).
The plot window above shows 3 data points plotted with only 1 point in each of the 3 series. These points were plotted from rows 12, 13, and 14 in a matrix containing 8 points in the rectangle [22:42, 11:16] (note: this is [column:column, row:row notation]). Points in rows 11, 15, and 16 were ignored and no point exists in row 14, which lies in range. The x-axis scaling extends from column 22 through 38 because that is the region covered by the matrix. The data and plot were generated by the following script:
|
|
-- create a new CMatrix |
|
|
-- add a point at y=16, x=22, value= 1 |
|
|
-- add other points |
|
|
|
|
|
|
|
|
|
|
|
|
|
|
|
|
|
|
|
|
-- create a new CPlotView |
|
|
-- create the line plot |
CPlotView class, PlotMatrixLine, PlotMatrix, PlotMatrixRange, AddMatrixRangeLine, CMatrix
Mira Pro x64 Script User's Guide, Copyright Ⓒ 2023 Mirametrics,
Inc. All Rights Reserved.