CPlotView:PlotMatrix
The PlotMatrix method plots all of the rows of a CMatrix using symbols. Each row of the matrix is plotted as a different plot series.
CPlot = CPlotView:PlotMatrix( CMatrix )
CPlot = CPlotView:PlotMatrix( CMatrix, sX )
CPlot = CPlotView:PlotMatrix( CMatrix, sX, sY )
CPlot = CPlotView:PlotMatrix( CMatrix, sX, sY, sTitle )
CPlot = CPlotView:PlotMatrix( CMatrix, sX, sY, sTitle, sCaption )
![]() CMatrix is
a matrix holding the data to plot. All lines (rows) are
plotted..
CMatrix is
a matrix holding the data to plot. All lines (rows) are
plotted..
![]() sX is the
optional x axis label. If nil, a default is used.
sX is the
optional x axis label. If nil, a default is used.
![]() sY is the
optional y axis label. If nil, a default is used.
sY is the
optional y axis label. If nil, a default is used.
![]() sTitle is
the optional window title. If nil, a default is used.
sTitle is
the optional window title. If nil, a default is used.
![]() sCaption is
the optional plot caption. If nil, a default is used.
sCaption is
the optional plot caption. If nil, a default is used.
Return value:
![]() CPlot is a new CPlot object
attached to the current plot series. It is nil on failure.
CPlot is a new CPlot object
attached to the current plot series. It is nil on failure.
|
|
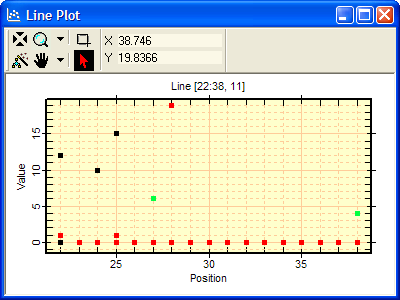
Line plot using default labels for x axis, y axis, title, and caption. The CMatrix contains one line, which is row 11. The caption above the plot box shows that columns 22 through 38 were plotted from row 11 through 14. The 3 series are shown in different colors and are over-plotted in this view. |
This method plots all of the rows of a sparse matrix stored in a CMatrix. The sparse matrix is filled with members that consist of a row and column index and a value. The fact that the CMatrix is sparse means that every cell does not have to be populated. In other words, indices do not need to exist between 1 and the minimum column or between 1 and the minimum row. Similarly, the matrix may have "holes" between minimum column and maximum column. Holes are filled with 0's, which can be seen in the sparse plot data plotted in window shown above.
To plot the same data as connected lines rather than as discrete symbols, use the PlotMatrixLine method. To plot a range of rows or a single row, use the PlotMatrixRange method.
The plot window above shows 4 data points having y=11 in the range x=22 to x=42. The data and plot were generated by the following script.
|
|
-- create a new CMatrix |
|
|
-- add a point at y=11, x=24, value= 10 |
|
|
-- add more points and other rows |
|
|
-- create a new CPlotView |
|
|
-- create the symbol plot |
CPlotView class, PlotMatrixRange, PlotMatrixLine, CMatrix
Mira Pro x64 Script User's Guide, Copyright Ⓒ 2023 Mirametrics,
Inc. All Rights Reserved.