Plotting an Averaged Line
Mira AP can plot an "average" line which is a arithmetic mean of adjacent lines (Horizontal or Vertical). The selection is made using the Plot Average... command which appears in various menus.
The examples below show the Median averaging method in use. Other methods may be selected using the Plot Averaging Mode command.
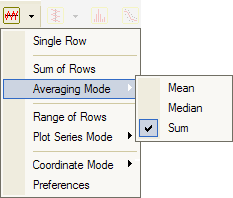
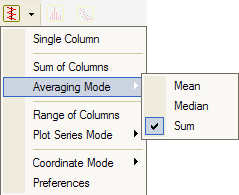
From the Column or Row Plotting Buttons on the main Toolbar (available when an Image window has focus).
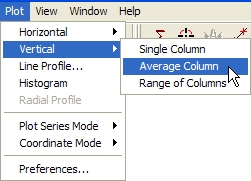
From the Plot Menu for Image Windows:
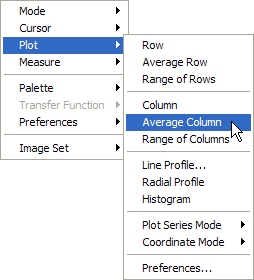
From the Image Context Menu:
To select the averaging mode, use the Averaging Mode command in the menu. This changes the setting for the currently active Image Window. To make the setting become the default for future plots, use the Plot Preferences page. See Plot Averaging Mode.