Plot Averaging Mode
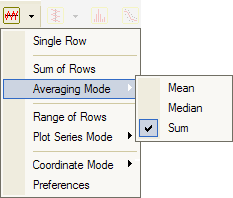
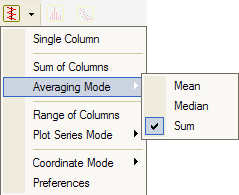
Use the Plot Average Column or Plot Average Row command to plot a single line that is the combination of a range of lines (columns or rows). The averaging mode is identified by the plot labels used by the various line averaging commands.
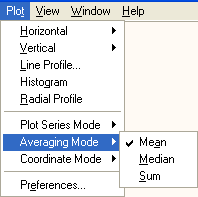
From the Plot Menu when an Image Window is active, click Plot > Averaging Mode to open the submenu as shown below. Select the desired mode from the submenu, then make the plot using the appropriate column or row command as described below.
Mira supports the following averaging modes:
|
Mean |
Calculates the arithmetic mean value of the adjacent columns or rows. |
|
Median |
Calculates the median value at each point in the adjacent columns or rows. |
|
Sum |
Adds the lines to make a single column or row that is the sum of adjacent columns or rows. This method is often used when extracting a spectrum from a 2-D image. |
To make the setting become the default for future plots, use the Plot Preferences page.