![]() Contour
Plot
Contour
Plot
The Contour Plot command computes 1 or more contours on an image. Contours are generated at specified levels. By comparison, the Interactive Contour Plot command allows you to mark the level where a single contour is to be created. Both commands are independent, so you can generate both types of contours on the same image.
Access Contour Plot commands from the
Plot > Contour Plot menu or the ![]() button on the Image Plot toolbar.
button on the Image Plot toolbar.
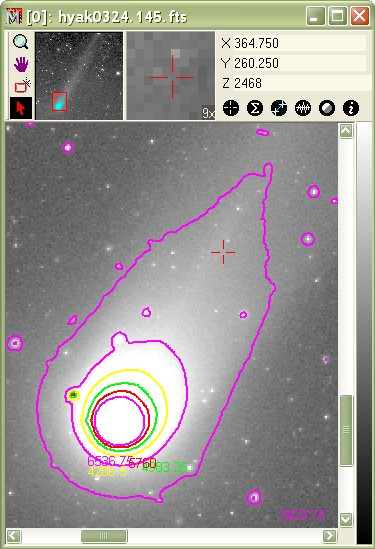
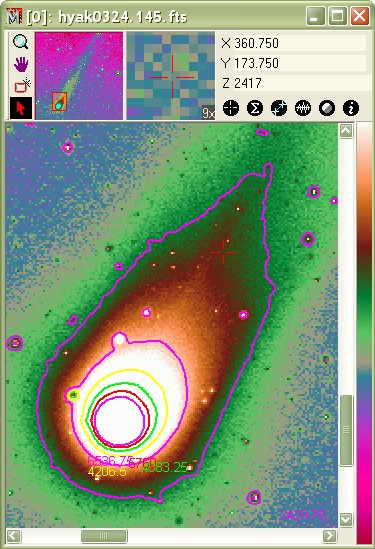
The example above illustrates using the preferences from the Contour Plot dialog shown below. The image on the right shows the same result with a pseudocolor palette applied.
The present command opens a dialog where you set the contour levels and related preferences. Clicking [Plot] then generates and plots the contours.
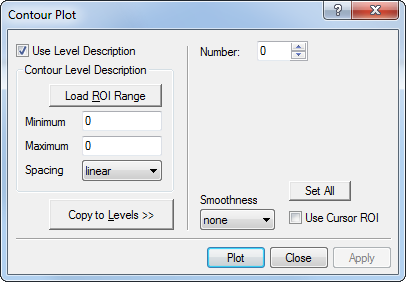
You may want to create contours at specific luminance values, or you may want to simply choose limits and let Mira compute the levels between. This is why the dialog is divided into a left and right hand portions, as follows:
The left side of the Contour Plot dialog has controls for calculating the contour levels from a description involving the minimum level, maximum level, and a method for spacing them between the limits.
The right side of the Contour Plot dialog contains the levels and other parameters that are used to generate the contours. You can type in the values yourself or you can have Mira calculate the levels using the Description parameters from the left side of the dialog.
Parameters of the Contour Plotting Command
|
Number |
The number of contours. |
|
Level [n] |
The value and color for the n-th contour level. Only 5 contour settings are visible; a selection scrollbar appears when more than 5 contours are specified. |
|
Set All |
Sets all contours to the same color. |
|
Smoothness |
Select the smoothness of the contours. |
|
Use Cursor ROI |
Check this option to contour only the region inside the image cursor. |
|
Use Level Description |
Check this option to enable the description fields on the left side of the dialog. This is a safety feature that prevents unintentional setting of contour levels. |
|
Load ROI Range |
Optionally loads the Minimum and Maximum fields using values measured inside the Region of Interest defined by the Image Cursor. |
|
Minimum |
The minimum value of the contour description. |
|
Maximum |
The maximum value of the contour description. |
|
Copy to Levels >> |
Computes the contour levels from the description parameters and copies the results into the level [n] fields. |
Open the Contour Plot dialog by clicking
the ![]() button on the Image Plot toolbar. You can execute the same
command using the Create command from
the drop menu accessed by the down arrow next to the toolbar
button. All contour plotting preferences are set within this
dialog.
button on the Image Plot toolbar. You can execute the same
command using the Create command from
the drop menu accessed by the down arrow next to the toolbar
button. All contour plotting preferences are set within this
dialog.
Set the contour preferences in the Contour Plot dialog. There are two strategies for defining the contour levels:
Specify a contour Description on the left side of the dialog, then click Copy to Levels >>, or
Enter contour levels you want to use into the fields on the right side of the dialog.
After
plotting contours, you can delete them from the image by the
Delete command from the drop menu
accessed by the down arrow next to the ![]() button.
button.
To change the contour levels, colors, smoothing, or other preferences, repeat beginning at step 1.
|
Note |
It is usually advisable to constrain the contour using as small a region as necessary by using the image cursor. Contours require drawing many short lines, and a complex contour containing a huge number of line segments may cause the computer to lag when redrawing the image window. |
With many complex contours visible, display
updating is sluggish. You can see this when you adjust the palette
or move the image cursor. To cure that problem, simplify the
contours, increase smoothing, shrink the contour region, or delete
the contour using the ![]() (delete all)
button on the contour toolbar.
(delete all)
button on the contour toolbar.
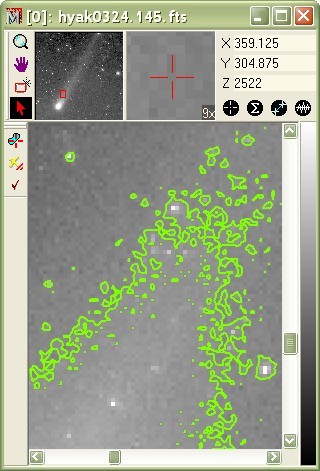
Below is shown a magnified view of the image above with a single contour having many wiggles. This contour was created using Smoothing = low, which creates many wiggles as the contour tracks through noisy, low level pixels. For more information about contour plotting in noisy areas of an image, see Contour Plotting with Various Levels of Smoothing.
|
Tip |
You can terminate the contour computation at any time by hitting the [Esc]key. This is especially handy if you start a contour computation after accidentally clicking on a level too far into the noise. |
Plotting Commands, Interactive Contour Plot, Contour Plotting with Various Levels of Smoothing