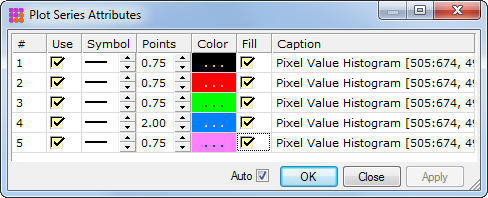
Plot Series Attributes
The Plot Series Attributes dialog is used to change the point properties after a plot is created. Use this dialog to change the marker style and size, color, and line thickness for an existing plot. Attributes may be set to different default values using the Plot Preferences page. You can also enable or disable separate series from being shown and change the caption for each series. Example
The Auto check box enables automatic updating of the plot after you change an attribute. Otherwise, changes take place when you click the [Apply] button.
Open this from the Plot Series Attributes menu command or the Ctrl+X accelerator.
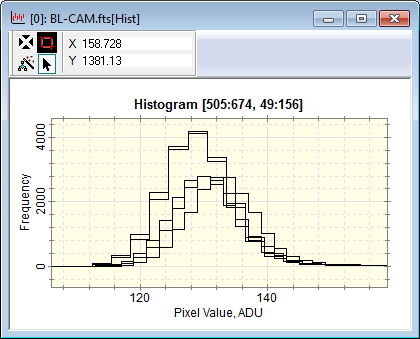
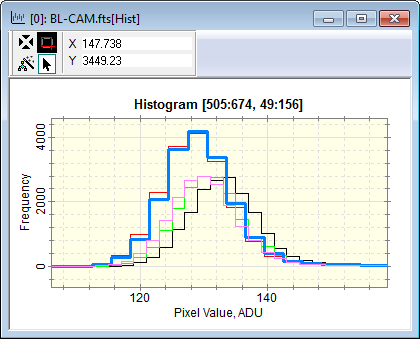
The example below shows a histogram oif an image set containing 5 series, before and after making the changes shown in the dialog above. Notice that 5 different colrs are used and that one of the lines has been thckened for emphasis;
|
Columns in the Plot Series Attributes Dialog |
|
|
# |
Indicates the index of the plot series in the Plot Window. you cannot change this value. |
|
Use |
Check this box to use the plot series in the window. If you uncheck the box, the series data continues to exist but does not get used in the final plot. Use this option to show or hide specific series. |
|
Symbol |
Use the up/down arrows to select the symbol type. This has no effect for a series that uses a line to connect the points. |
|
Points |
Use the up/down arrows to change the point size of the symbol or the point thickness of the line for the series. One point equals 1/72 inch; a value of 0.75 to 1.0 points is about the thickness of a single pixel on a typical computer monitor. |
|
Color |
Double click the color swatch to change the color assigned to the series. This changes the marker color or line color, depending upon the type of plot. |
|
Fill |
Check this box to fill the plot symbol with solid color. Otherwise the symbols are only outlined. |
|
Caption |
This field lists the caption for the plot series. You can edit captions and save them to the Plot window. |
This dialog allows you to change the properties of a single plot series as described in the table above. The procedure used to change multiple rows is similar to the Edit > Fill procedure in Microsoft Excel. For example, you may wish to emphasize a range of plot series using a thick line and a bright color.
1. Point the mouse at the cell having the property you want to copy and press the left mouse button. Do not release the mouse button or you may change the cell value rather than highlight it.
2. If you wish to change more than 1 column, drag the mouse to the left or right to highlight the other cells.
3. Drag the mouse to other rows. Release the mouse button on the final row.
4. Right click the mouse inside the highlighted area and select the appropriate option.