Plot Preferences
The Plot Preferences page is a member of the Mira Preferences dialog. Use this page to configure the way plots are created from images. If opening this dialog directly from an Image Window via the Image Context Menu, the settings may be applied to that window only. They may also be used as defaults for all future Image Windows.
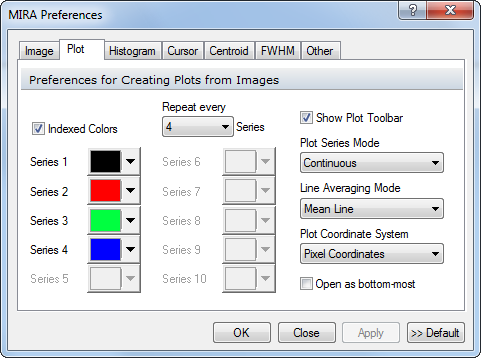
To open the Plot Preferences page either use the Plot > Preferences menu item or open the Mira Preferences dialog and select the Plot tab.
|
Indexed Colors |
This options controls the choice of colors used for different plot series. Check this box to use the available color options for drawing successive plot series. If unchecked, all plot series are drawn using the color of Series 1. |
|
Repeat every |
Specifies the number of series per cycle of the assigned colors. The colors specified on this page are repeated every n series, where n is defined in this field. This is used only if Indexed Colors is checked. |
|
Series 1, ... Series 10 |
These buttons set the colors used to draw each of the plot series in cycles defined by the Repeat every setting. The specified colors for Series index 2 through 10 are used only if Indexed Colors is checked and Repeat every > 1. |
|
Show Plot Toolbar |
Uncheck this box to hide the Plot Toolbar at the top of the Plot Window. Check it to re-display the toolbar after hiding it. |
|
Plot Series Mode |
Selects whether new plot series are created in Animate mode or Overplot mode. Animate mode shows 1 series at a time and shows the Plot Animation Toolbar. Overplot mode shows all plot series simultaneously. |
|
Plot Coordinate System |
Selects whether images are plotted using pixel coordinates (column, row) or world coordinates. |
|
Open as bottom-most |
Check this box to open new plot windows below the image window. When making many plots from a single image, you can check this box to avoid having to repeatedly pop the image window back to the top after each new Plot Window is displayed. |
Mira allows you to assign specific colors to every n-th plot series. You also can assign other attributes such as line thickness or marker shape to every n-th series. These attributes apply to all plots, including Overplotted Line Profiles, Column and Row Profile plots, and so forth.
To give all series the same color, un-check the Use Indexed Colors box. This gives all series the color of Series 1. To change the colors of other series, check the Use Indexed Colors box, set the Repeat every counter as desired, and then click the Series n button to set the colors. The value of Repeat every (n) series causes the series color to cycle every (n) series. The button opens the a Color Choice palette.
To give all series the same color, un-check the Use Indexed Colors box. This gives all series the color of Series 1. To change the colors of other series, check the Use Indexed Colors box, set the Repeat every counter as desired, and then click the Series n button to set the colors. The value of Repeat every (n) series causes the series color to cycle every (n) series. The button opens the a Color Choice palette.
To give all series the same attributes, un-check the Use Indexed Colors box. This gives all series the attributes of Series 1. To change the attributes of other series, check the Use Indexed Colors box, set the Repeat every counter as desired, and then click the Series n button to set the attributes of every n-th series. The value of Repeat every (n) series causes the series color to cycle every (n) series. The button opens the Series Default Attributes dialog.
|
Tip |
When adding series using the Move mode of the Line Profile Plot, you can use this feature to highlight a new series before you plot it. Determine which series will be added by the move command, then set the desired color for the appropriate series index in the Plot Preferences dialog. |
When more than one plot series is displayed, you have the choice to view the series as an Overplot on the same set of axes or as individual series. This is controlled by the Plot Series Mode. To set the Plot Series Mode, right click inside the Plot Window to open the Plot Context Menu.
To view individual plot series, choose Plot Series Mode > Animate from the Plot Context Menu. Animate mode uses the Plot Animation Toolbar for switching between series either manually or automatically.
The Plot Toolbar appears at the top of a Plot Window. If you do not want the toolbar to appear in Plot windows, un-check the Show Plot Toolbar box. To apply this setting henceforth in this session of Mira , save your changes using the [OK] or [Apply] button. To change it for future sessions of Mira , click the [Save] button.
Set the preferences as desired, then accept the changes by doing the following:
To change only the active Image Window, click [Apply] or [OK].
To change for all future Image Windows, click [Save].
When you are finished, close the Mira Preferences dialog.
Plot Windows, Adding Series to a Line Profile Plot, Plot Animation Toolbar, Mira Preferences dialog, Series Default Attributes, Plot Series Attributes