Plot Series Data
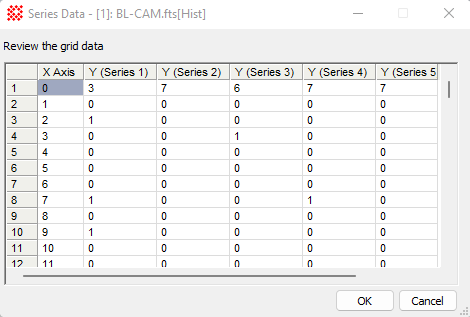
Use the Plot Series Data command displays the data for all plot series owned by a Plot window The data are tabulated along with the x axis value in the Series Data dialog. The data may be inspected, saved to a file, copied to the clipboard, graphed, or you may execute a script on the data. Since this window contains a Grid Control, you can do script-based analysis of its data using the Execute Script command in its pop-up menu. See the Script Execution topic under Grid Controls.
Open the Plot Series Data command from the Plot Menu or the Plot Context Menu.
The picture below shows the Plot Series Data dialog for a histogram plot of 5 of the "BL-CAM" sample image provided in this Mira distribution.
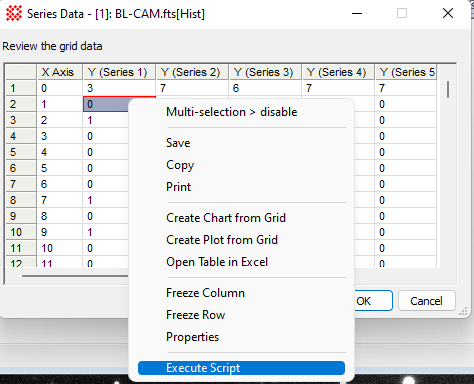
The screen capture below shows the window's pop-up menu with Execute Script selected. Note that the Plot Window and Plot Series Dialog may contain many points when you execute a script that does something like a least squares fit to every grid point.
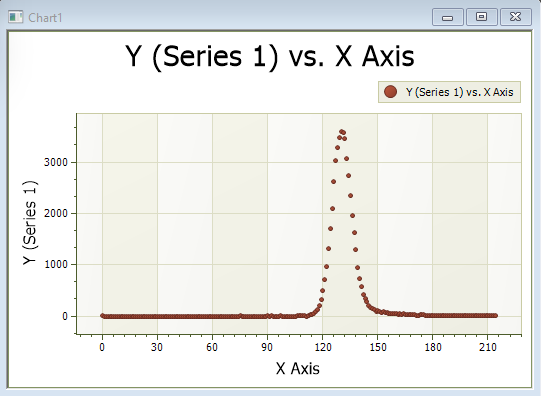
The screen capture below shows the result of the Create Chart from Grid command in the pop-up menu. Note that this command graphs only one plot series in this , the column "Y (Series 1)" was selected. The chart properties can be altered using commands in its pull-down menu or pop-up menu.
Mira Pro x64 User's Guide, Copyright Ⓒ 2023 Mirametrics, Inc. All
Rights Reserved.