Grid Controls
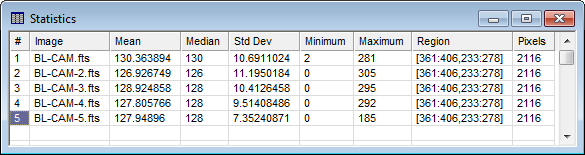
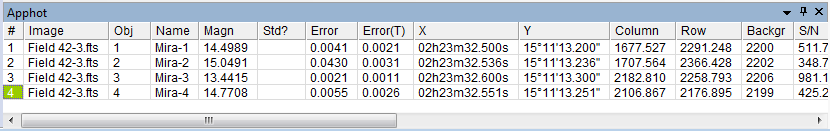
A Grid Control displays data as a table of columns and rows. When measurements are displayed in a grid control, one row of the grid contains one measurement. Grid controls are displayed in Measurement Panes and Report Windows. The Statistics Report Window and Apphot pane shown below both contain grid controls. The Report Window is an independent top level window whereas the measurement pane is a window owned by a top-level window. Several common tools, such as Create Plot from Grid and Create Chart from Grid are available for all grid controls. Grid controls in Report Windows may be created or attached from scripts using the CGridView class in the Pro Script Module. See the Mira Pro x64 Script User's Guide.
Grid Controls are used by the following features. Some grids are displayed in a Report Window and others are displayed in a Measurement Pane:
Grid controls are used by the following windows and commands:
The Mira Pro Script language provides an immense collection of script functions and classes to work with data in a Grid Control, either as a Report Window or Measurement Pane. In addition, scripts can be executed (launched) directly from most Grid Controls to work with the grid data. The Execute Script command in the pane's Grid Context Menu opens for selecting a script, then executes the script. When the script is executed, it is automatically sent a CGridView object attached to the grid data. The installed folder <Documents>/Mira Pro x64 Data/Scripts/Samples contains a sample script to be called from a Report Window, named "Execute from a Grid Window test.lua" and another one to be launched from a Measurement Pane, named, "Execute from a Grid Pane test.lua". The "Execute from a Grid Control with Least Squares fit.lua" sample script fits data from two columns of the grid. See the Mira Pro x64 Script User's Guide for details.
Various commands that work with the grid data, such as Copy, Create Plot from Grid, and Create Chart from Grid can use the entire table or use data only in specific cells of the grid. To work with specific cells, those cells must be "selected". A grid cell is "selected" when it is marked, or highlighted. Marking cells in a table works essentially the same way you select files from the Open dialog or you select cells in Microsoft Excel. Cell selection is started by pressing the left mouse button down on the starting cell, then you drag to the last cell in the block. However, there are some variations on this basic theme which add capability to commands that work with table data.
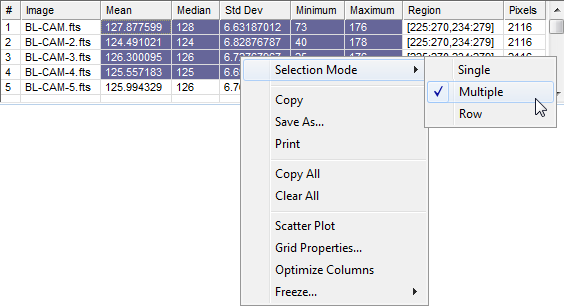
The pull-down View menu for Report Windows and the Grid Context Menu both contain a popup menu named Selection Mode. Three selection modes are available for marking cells; these are:
Single: allows only single cells to be selected at one time. This means that the entire table is used by commands.
Multiple: allows a rectangular block of cells to be selected.
Row: allows entire rows to be selected.
The Multiple and Row modes allow more than one cell to be selected at one time. The basic procedure for marking multiple cells involves pressing the left button down on the first cell (left button down and hold), then dragging the mouse to the final cell.
Grids open with the column width adjusted to hold typical data. However, very long character strings, such as long image names of, say, 70 characters, can dominate the grid width in a single column that accommodates the long name. The Default max cell width parameter in the General Properties dialog limits the initial width of grid columns. However, all grid columns may be adjusted as desired or auto-scaled after the grid opens. A typical maximum cell width is around 200 pixels.
You can also add cells that are not touching a marked block by using the Windows standard[Ctrl] key modifier. Here are the rules for marking multiple cells in Multiple Mode or Row Mode:
To mark a block of cells, mouse down on the starting cell, then drag the mouse to the final cell. Release the mouse button at the final cell
To begin marking an additional block of cells, press the[Ctrl] key before pressing the left mouse button down on the starting cell. With[Ctrl] pressed, click on the starting cell and repeat step (1).
Repeat step (2) to mark each additional block.
Using these rules, you can mark any group of cells in the table. For example, the picture below shows a Statistics Report with 3 blocks selected using these rules:
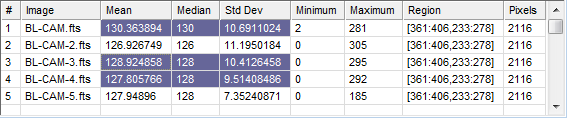
Here is the recipe for marking 3 rows of cells as shown in the picture above:
Right click on the report table to open the Grid Context Menu. Select Selection Mode > Multiple.
Mouse-down on "130.363894" and drag right to "10.6911024". Release the mouse to mark the first block.
Press and hold [Ctrl]. Then mouse-down on "128.924858" and drag downward and to the right to "9.51408486". Release the mouse to mark the second block.
If you were to use the Copy command in the menu, only these 2 groups of cells would be copied to the Windows clipboard.
Marking rows works the same as for marking cells in Multiple Selection Mode, except that clicking anywhere in a row marks the entire row. Dragging the mouse in Row Selection Mode marks a block of rows. You can mark separate blocks of rows using the [Ctrl] key as described above.
|
Note |
To use the Create Plot from Grid command to plot specific rows of data, you must use Row Selection Mode, not Multiple Selection Mode to mark the target rows. |
Each Measurement Pane or Report Window provides some functionality to adjust its contents for display purposes. You can sort the rows by any column and you can reorder the columns so that certain quantities become adjacent to each other. These adjustments can be combined with the copy, save, or print commands to select particular data from the table. See the Tutorial: Working with Measurements in a Grid.
|
Operation |
Procedure |
|
Resizing a Column |
Mouse down on the column separator line and drag the separator until the column is the desired width. Release the mouse at the final size. |
|
Sorting Rows by values in a column |
Click on the column header to to perform the sort. A sorting triangle then appears inside the column label. Click again to reverse the sort order. |
|
Reordering Columns |
Mouse down on the column header away from the separator. Drag the mouse pointer outside the cell and the left column separator will appear in bold. Drag the separator to the insertion point and release the mouse. The column of data will move to the insertion point. |
|
Editing Data |
Click on the cell you wish to edit and the cell will highlight to show that edit mode is enabled. After changing the text, save your changes by either clicking outside the cell or moving outside the cell using the keyboard arrow keys. |
|
Creating a Scatter Plot |
Use the Create Plot from Grid or Create Chart from Grid command to plot data in one report column against data in another column. |
The Grid Context Menu provides commands for working with data in the grid control. To open the Grid Context Menu, right click on the grid.
Usually you will want to copy or otherwise export measurements from the Grid Control into other software or send it to permanent storage. In the example below, we use the tabular data for Statistics. To copy the entire grid, use the Copy All command in the Grid Context Menu. To work with only a range of cells, follow the procedure described below.
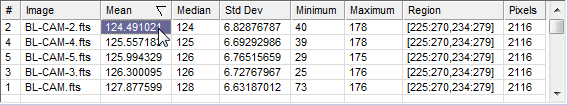
When measuring statistics, you get a table with various quantities listed in its 9 columns and several rows. Suppose you only want to save the Mean, Median, Std Dev, Minimum, and Maximum values. Then you need to select only these cells from the table. To extract these cells, right-click on the grid to open the Grid Context Menu. For a Measurement Pane, you also can use the menu (triangle) button on the pane's title bar. In the Grid Context Menu, be sure that the Selection Mode is set to use the entire grid or just the selected cells or rows (if not, change the setting in the menu) as shown below
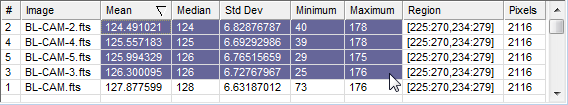
Next, point the mouse at the top left cell of interest, drag the mouse to the lower right cell of interest, and release the mouse button. A region selected in this way is shown in the figure below.
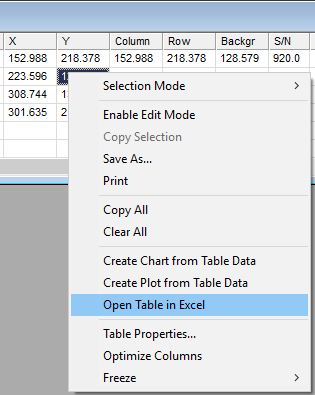
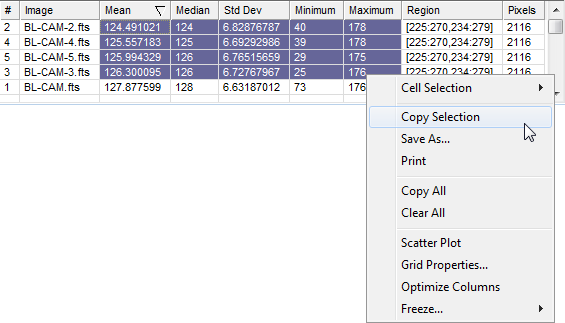
With the target cells highlighted, right click on the table to open the Grid Context Menu. As shown below, click the Copy Selection item to copy the selected cells to the Windows clipboard. Note: If only a single cell is selected, this command appears simply as Copy.
To complete the operation, activate the software where you wish to paste these cells and use the Edit > Paste command (or similar procedure) to transfer the data into the target software.
Mira Pro x64 User's Guide, Copyright Ⓒ 2023 Mirametrics, Inc. All
Rights Reserved.