Plot Y Axis Properties
The Y Axis Properties page allows you to configure the vertical (y) axis of a plot in a Plot Window. Use this page to change the number and style of tick marks and set the axis extent. Some changes update the plot immediately while others do not. Click the [Apply Changes] button to update the plot with all settings on the page.
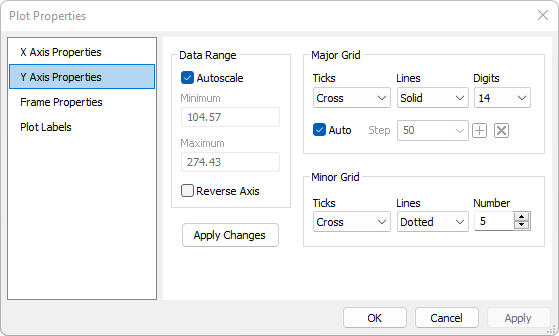
To open the Y Axis Properties page, open the Plot Properties dialog and select the Y Axis Properties tab.
|
Y Axis Properties |
|
|
Data Range |
These properties control the extent of the Y AXIS. |
|
|
Check this box to autoscale the Y AXIS between the minimum and maximum values of the data. If the box is unchecked, enter your values into the Minimum and Maximum fields. |
|
|
Check this box to reverse the direction of the Y AXIS. |
|
[Apply Changes] |
Immediately updates the plot using all settings. |
|
Major Grid |
These properties control the way the major grid is drawn along the Y AXIS. |
|
Ticks |
Choose the type of major ticks drawn along the axis edges. |
|
Lines |
Select the type of lines drawn between major ticks on opposite sides of the plot. |
|
Digits |
Select the number of digits of precision in the axis labels. |
|
|
Check this box to have the interval between major Y AXIS automatically selected. If unchecked, enter the interval or select it from the history list at right. |
|
Minor Grid |
These properties control the drawing the minor grid within the major grid. |
|
Ticks |
Choose the type of minor ticks drawn along the axis edges. |
|
Lines |
Select the type of lines drawn between minor ticks on opposite sides of the plot. |
|
Number |
Select the number of minor grid intervals per major grid interval |
|
Tip |
A new plot is created with the y axis automatically
adjusted to the full range of the data. This is the same as
checking the Auto option in this
dialog. If you uncheck Auto and enter
new limits, you can can return to the autoscaled values by clicking
the |
Mira Pro x64 User's Guide, Copyright Ⓒ 2023 Mirametrics, Inc. All
Rights Reserved.