Plot Bar
The Plot Bar is a docking pane "toolbar"
that provides frequently used commands for adjusting the appearance
of plot data. It also displays the coordinates of the mouse pointer
moving over the plot. The Plot Bar can be opened or closed
using the ![]() button on the Docking Panes
Toolbar.
button on the Docking Panes
Toolbar.
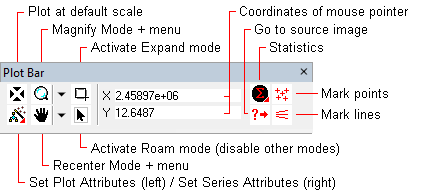
Several Plot Bar controls are duplicated by commands in the main menus for the Plot Window. The controls on the Plot Bar are described in the following table.
|
Plot Bar Buttons |
|
|
|
Re-plots the data at the default scale. The X and Y axes are autoscaled to fit all the data within the plot space. |
|
|
Enables Magnify mode, which magnifies up and down by dragging the mouse at a point. The range is 1/10x to 10x in both axes. To magnify the image:
Using the Drop Menu: The drop arrow opens a menu with 3 constrained magnify commands. These commands magnify in 1/2x and 2x steps horizontally, vertically, or in both directions. To use these buttons,
|
|
|
Activates Expand Mode. In this mode you rubber-band a rectangle around a region of data you wish to enlarge. Disable Expand Mode by clicking the Roam button. |
|
|
Changes the plot appearance by setting attributes. The red triangle at lower right signifies that this button has both left-click and right-click functions.
These commands are also available from the main menu for Plot Windows at the top of the Mira desktop. |
|
|
Enables Centering mode, which shifts the plot data within the plot box. Use this to re-position the data or bring different data into view. To re-center the image:
Using the Drop MenuThe drop arrow opens a menu with 2 constrained re-centering commands for shifting the plot horizontally or vertically.
|
|
|
Activates Roam Mode. This disables all command modes for the Plot Window, including modes of other toolbars. |
|
|
Left-click to calculate statistics for the current plot. Right-click to open the Statistics Properties dialog for choosing the statistic and setting its parameters. The statistics appear in a Plot Statistics Docking Pane for the Plot Window. To plot the statistic over the plot data, right click on a line in the Statistics Pane to open its menu, then select Mark Statistic. The red triangle at this button's lower right signifies that the button has both left-click and right-click functions.
These commands are also available from the main menu for Plot Windows at the top of the Mira desktop. |
|
|
Click this button to go to the Image Window that created the plot. See the Go to Source Image topic. |
|
|
Click this button to open the Plot Point Measurements toolbar for marking points on the plot. Click again to close the toolbar. This command is also available from the main menu for Plot Windows at the top of the Mira desktop. |
|
|
Click this button to open the Plot Line Measurement toolbar for marking lines on the plot. Click again to close the toolbar. This command is also available from the main menu for Plot Windows at the top of the Mira desktop. |
Mira Pro x64 User's Guide, Copyright Ⓒ 2023 Mirametrics, Inc. All
Rights Reserved.