CPlotView:AddMatrixRange
The AddMatrixRange method adds data from a range of rows in a CMatrix as new series in the Mira Plot Window attached to the class. This method uses an external matrix, not the class data matrix. The data are plotted as symbols. Each matrix row creates a different plot series.
bSuccess = CPlotView:AddMatrixRange( CMatrix, y1, y2 )
![]() CMatrix is
a matrix holding the data to plot.
CMatrix is
a matrix holding the data to plot.
![]() y1 is the
minimum row number to plot, beginning at row 1.
y1 is the
minimum row number to plot, beginning at row 1.
![]() y2 is the
maximum row number to plot, beginning at row 1.
y2 is the
maximum row number to plot, beginning at row 1.
![]() On
success, the method creates a plot window and returns true.
On
success, the method creates a plot window and returns true.
![]() On
failure false is
returned.
On
failure false is
returned.
|
|
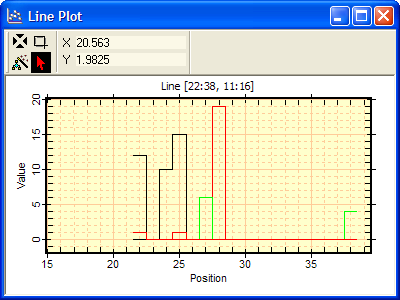
Plot created using the PlotMatrixLine method and the top portion of the script example listed below. |
|
|
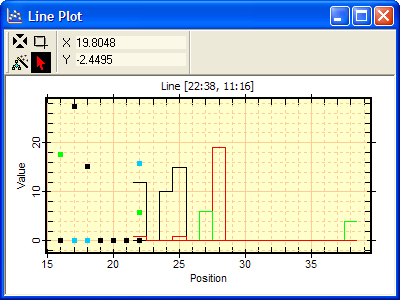
Result of using the present AddMatrixRange method to add data series to the plot shown above. This was done using the lower portion of the script example listed below. The plot window automatically re-scaled to accommodate the new data. Compare with the lower picture in AddMatrixRangeLine. |
This method adds data stored in a CMatrix to an existing Plot Window. The new data are plotted as point symbols and each matrix row creates a new series with its unique symbol attributes. This method adds the CMatrix point at ( row, col, value ) to the existing plot as ( series, x, y ). Each matrix row defines a different series.
The data added to the plot are specified by the range of CMatrix rows passed as parameters. Not every row within this range must exist in the matrix. For example, if you specify y1=10 and y2=100 and the matrix has data in every row, then 91 rows of data are added to the plot. Alternatively, if there are data only in matrix rows 10, 20, and 50, then y1=10 and y2=100 adds only 3 rows of data to the plot. Alternatively, you can make the same type of plot, but with connected lines rather than symbols, using the PlotMatrixRangeLine method. PlotMatrix methods plot all rows of the matrix, rather than a range of rows.
The plot windows shown above were created using the following script, which is included in the sample file "Plot Matrix Test.lua". First, a CMatrix is filled with points and plotted as a lineplot using PlotMatrixLine to produce the upper plot of the two shown above. Then the matrix was emptied, 5 new points were defined, and the present method was called to add them to the plot, which produced the lower window shown above.
|
|
-- create a new CPlotView object |
|
|
-- create a CMatrix and add points |
|
|
|
|
|
|
|
|
|
|
|
|
|
|
|
|
|
|
|
|
|
|
|
|
|
|
-- plot the matrix as a stepline |
|
|
|
|
|
-- clean out the CMatrix |
|
|
-- add point at row 12, column 22 |
|
|
-- add point at row 12, column 16 |
|
|
-- add point at row 13, column 22 |
|
|
-- add point at row 12, column 22 |
|
|
-- add point at row 12, column 16 |
|
|
-- add CMatrix rows as new series |
|
|
|
|
|
|
|
|
|
CPlotView class, PlotMatrixRange, PlotMatrix, CMatrix
Mira Pro x64 Script User's Guide, Copyright Ⓒ 2023 Mirametrics,
Inc. All Rights Reserved.