Plotting Examples
Below are shown some examples that illustrate the image plotting capabilities of Mira.
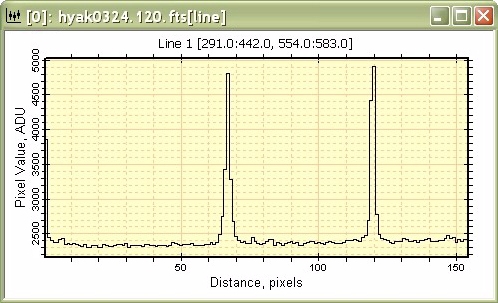
The figure below shows a simple Line Profile plot in Pixel Coordinates.
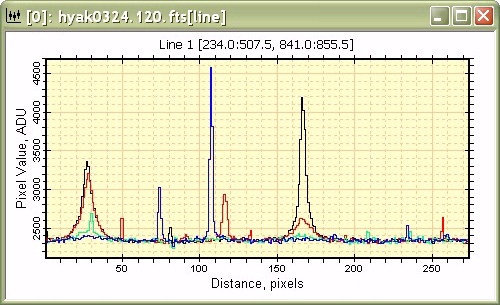
The following example shows a Line Profile with several Overplotted Plot Series created from data along lines parallel to the first line.
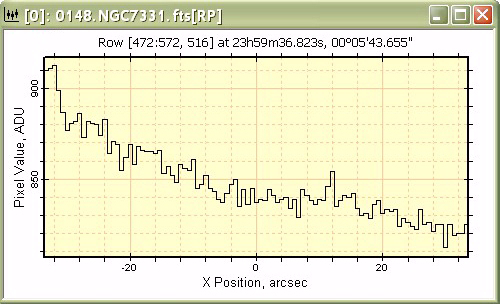
The figure below shows a Row Profile from an image with a World Coordinate System calibration.
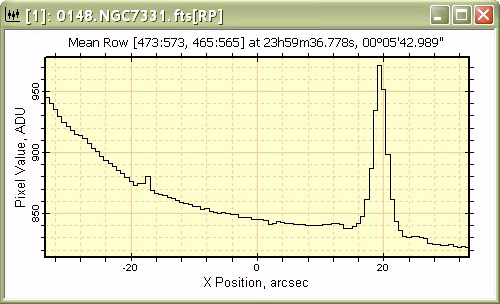
The next figure below plots an Average Row sampled over 101 rows and using world coordinates.
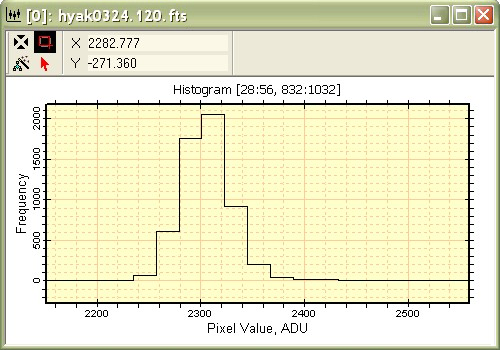
The next plot shows a histogram of pixel values inside a rectangular region of the image.
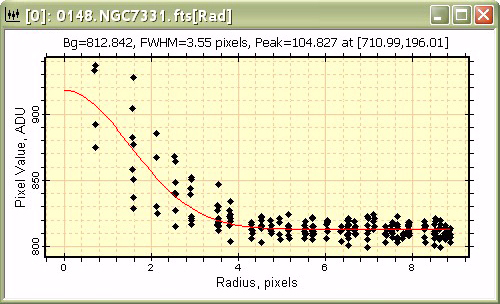
The following plot shows a Radial Profile plot with the FWHM value calculated from a fit to a point in the image data.
The following plot shows a Pixel Series Plot. This graph shows points at the same location vary among different images of an image set. The points from a given image all have the same color.
![]()