Chart Properties Pane
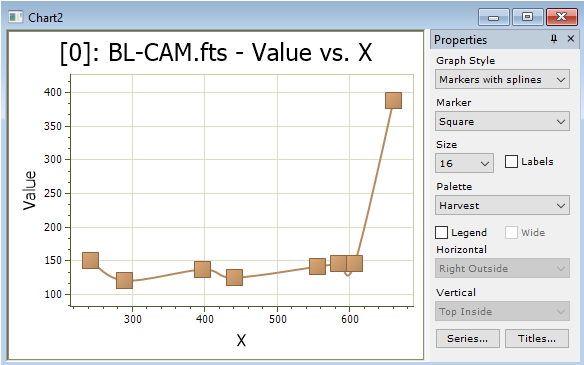
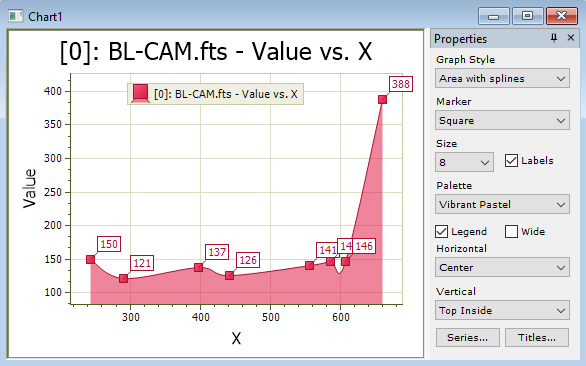
The Chart Properties Pane is used to change the properties of the chart after the chart is created. Similar properties can be set before chart creation in the Create Chart from Grid dialog. As with all docking panes, this pane can be shrunk to a tab on the window border, pinned open, closed, etc. (see the Pane Button on the Main Toolbar). The example below shows the original chart (top) and the chart modified using settings in the Chart Properties Pane.
The Chart Properties Pane opens from the Chart Command Menu.
|
Properties of the Chart Properties Pane |
|
|
Graph Style |
Selects the type of graph to be created: Markers: Creates a scatter plot using markers. Markers with Lines: Creates a scatter plot using markers connected by lines. Markers with Splines: Creates a scatter plot using markers connected by splines. Bars: Creates a bar plot. Area: Creates an area plot. Area with Splines: Creates an area plot with values connected by splines. |
|
Marker |
Select the marker from selections in the drop box. |
|
Size |
Select the marker size from selections in the drop box. |
|
|
Check this box to show Y-Value labels for each point. |
|
Palette |
Select the point, line, and area color scheme from selections in the drop box. |
|
|
Check this box to display a legend on the chart. |
|
|
Check this box to display a horizontally directed legend. |
|
Horizontal |
Select the horizontal legend location from selections in the drop box. The "Inside" and "Outside" options relate to the horizontal position of the chart box limits. |
|
Vertical |
Select the vertical legend location from selections in the drop box. The "Inside" and "Outside" options relate to the vertical position of the chart box limits. |
|
Series |
Click this button to open the Chart Series Properties dialog. |
|
Titles |
Click this button to open the Chart Titles dialog. |
Mira Pro x64 User's Guide, Copyright Ⓒ 2023 Mirametrics, Inc. All
Rights Reserved.