Chart Series Properties
The Chart Series Properties dialog is used to modify the properties of different data series in the chart. A series is a group of points sharing the same properties. For example, a chart might be created for measurements of an image set in which the image name is used to group measurements for each image. The stratification of the measurement data into groups or "series" (in this example, by image name), is accomplished using the Group By option in the Create Chart from Grid command. Initially, a different palette color is used to distinguish the series. After chart creation, the present command is then used to apply additional changes to individual chart series.
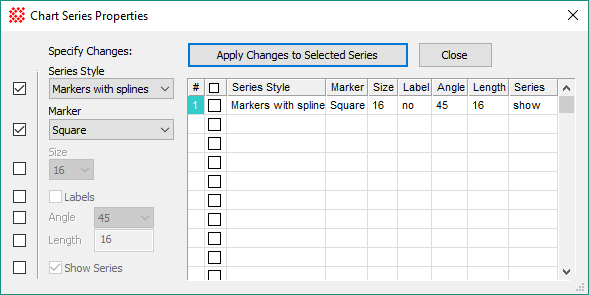
The Chart Series Properties dialog opens from the Chart Command Menu.
The series properties grid in the right portion of the dialog lists the current properties for each chart series. To change any of these properties, follow these steps:
In the left column, check the box for each property to be set.
Under Specify Changes, make changes to the selected properties.
In the series properties grid, check the box (or boxes) of the target series where your changes are to be applied.
Commit changes by clicking the Apply Changes to Selected Series button.
Properties in the table below are located under the Specify Changes column in the dialog. A property change is enabled by checking its box in the column on the left side of the dialog.
|
Properties of the Chart Series Properties dialog |
|
|
Series Style |
Selects style for graphing the series: Markers: Creates a scatter plot using markers. Markers with Lines: Creates a scatter plot using markers connected by lines. Markers with Splines: Creates a scatter plot using markers connected by splines. Bars: Creates a bar plot. Area: Creates an area plot. Area with Splines: Creates an area plot with values connected by splines. |
|
Marker |
Select the series marker from selections in the drop box. |
|
Size |
Select the size of the series marker from selections in the drop box. |
|
|
Check this box to show Y-Value labels for each point of the series. |
|
Angle |
Enter the angle, in degrees, of the label relative to its data point. This is inactive if Labels is unchecked. |
|
Length |
Enter the length, in screen pixels, of the line between the label and its the data point. This is inactive if Labels is unchecked. |
|
|
By default, this box is checked to display the series. To hide the series from the chart, uncheck the box. |
Mira Pro x64 User's Guide, Copyright Ⓒ 2023 Mirametrics, Inc. All
Rights Reserved.